


Reading LTC/BTC: ratio arithmetic, benchmarks and trading limits
Calculate LTC/BTC and relative returns with matching timestamps. Worked examples distinguish dollar gains from Bitcoin outperformance.
The LTC/BTC ratio measures Litecoin's price in bitcoin. It answers a different question from an LTC/USD chart: whether one unit of LTC buys more or less BTC over time.
Reviewed 18 September 2026. The examples below are hypothetical. Fixed trading signals and unsupported claims that a low ratio must revert have been removed.
Read the units before reading the chart
If the two dollar prices are observed at the same time, the cross rate is:
LTC/BTC = LTC price in USD / BTC price in USD
At illustrative prices of $54 per LTC and $64,000 per BTC:
| Calculation | Result |
|---|---|
| 54 / 64,000 | 0.00084375 BTC per LTC |
| Ratio multiplied by 100,000,000 | 84,375 satoshis per LTC |
| Inverse ratio | About 1,185.19 LTC per BTC |
These are conversion calculations, not verified historical quotes. Mixing a current LTC price with a stale BTC price produces a misleading ratio.
Use the LTC/BTC ratio tool and check the observation times and data status. A direct exchange pair can differ slightly from a synthetic ratio because of spreads, liquidity and the venues used.
Relative return is a division, not a subtraction
The exact relationship is:
Relative return = (1 + LTC return) / (1 + BTC return) - 1
| Hypothetical period | LTC/USD return | BTC/USD return | LTC/BTC return |
|---|---|---|---|
| Both rise, BTC rises faster | +20% | +50% | -20% |
| Both fall, LTC falls less | -10% | -20% | +12.5% |
| LTC rises, BTC is unchanged | +10% | 0% | +10% |
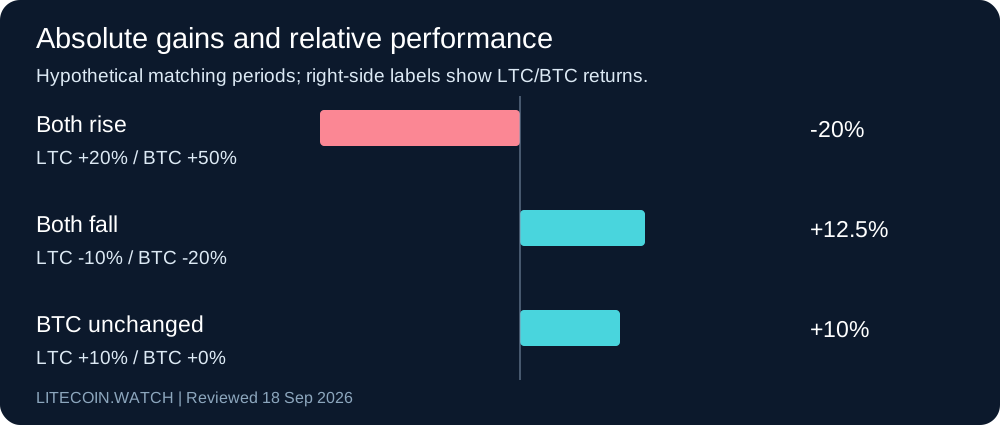
The first row shows why making dollars and outperforming Bitcoin are not synonymous. The second shows why relative strength can coexist with an absolute loss.
Choose the benchmark deliberately
A BTC-denominated investor may care about increasing BTC holdings. Someone with rent and other obligations in local currency must also consider the local-currency result. Neither benchmark is universally correct.
State the benchmark before judging a strategy. Otherwise, it is easy to celebrate whichever chart looks better after the fact.
A portfolio containing both assets also needs weights. A 10% position outperforming its benchmark does not establish that the whole portfolio outperformed.
A low ratio is not a valuation floor
Historical support and resistance describe past trading behaviour. They do not create a contractual obligation for buyers to return at the same price.
Relative value needs a thesis about demand, supply, liquidity and the relevant time horizon. “It used to trade higher” supplies a reference point, not the mechanism for recovery. Structural changes can persist.
A useful chart review records the timeframe, source, exact levels being discussed and what would invalidate the interpretation. It should distinguish an observation from a trade recommendation.
Execution can change the result
A strategy that switches between LTC and BTC must account for spreads, trading charges, slippage and custody. An apparent opportunity in displayed prices may disappear at the intended order size.
Leverage adds liquidation and funding risks. A relative-value thesis can eventually prove directionally right while a leveraged position is closed much earlier. Spot holdings and derivative positions therefore need separate accounting.
For arithmetic, use the calculator and portfolio tool. Record deposits and withdrawals separately from investment returns; adding capital can increase the portfolio value without demonstrating performance.
A compact research checklist
Before publishing a ratio analysis, record matching timestamps, pair direction, venue, sampling frequency and missing-data treatment. Calculate returns from the same start and end observations.
If discussing a backtest, specify when the signal was available and when a trade could actually execute. Include costs and failed or unavailable trades. Choosing thresholds after inspecting the entire history can make a weak strategy appear persuasive.
Frequently asked questions
Does a falling LTC/BTC ratio mean LTC fell in dollars?
No. LTC can rise in dollars while Bitcoin rises faster.
Is 0.00084375 a price target?
No. It is the result of the clearly labelled $54 and $64,000 illustration.
Is a historically low ratio proof that LTC is undervalued?
No. A historical comparison is not an independent valuation model or guarantee of recovery.



Track Litecoin in real time
Rates for 30+ currencies. Check each tool for its latest source timestamp.
Open dashboard