52.89 $
-1.95% -1.05 $
52.89 $
-1.95% -1.05 $
52.89 $
-1.95% -1.05 $
52.89 $
-1.95% -1.05 $

A detailed preview of the September 15–16 FOMC meeting: verified policy and inflation data, LTC versus BTC charts, four conditional scenarios and downloadable market data.
Pre-decision edition. Research cutoff: September 14, 2026, 22:40 UTC. Market charts end with the September 13 UTC day. The September decision had not occurred at this cutoff. Hero image: AI-generated editorial illustration.
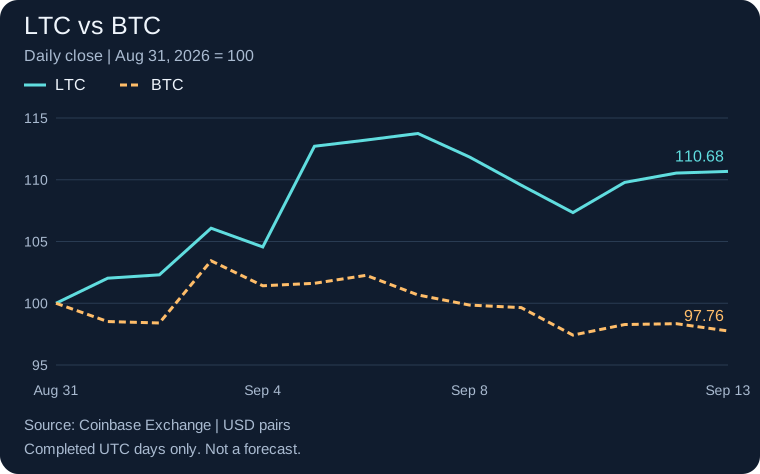
Litecoin enters the September Federal Reserve meeting after a clear divergence from Bitcoin in our fixed comparison window: LTC rose 10.68% from the August 31 close to the September 13 close, while BTC fell 2.24%. That relative strength is observable. Whether it persists through the policy announcement is a different question, and the price history alone cannot answer it.
The useful preparation is to establish three baselines: the policy setting before the meeting, the economic information already released, and the prices recorded before the announcement. Then compare the actual decision and market response with those baselines. This article provides that framework, rather than treating a rate cut, a hike or a particular LTC price target as predetermined.
The Federal Open Market Committee is scheduled to meet on September 15–16, 2026. September is also a meeting accompanied by economic projections. The official monthly calendar lists the policy event at 2:00 p.m. Eastern Time on September 16 and the press conference at 2:30 p.m. FOMC schedule; September event calendar.
| Event | New York (EDT) | UTC | Warsaw (CEST) |
|---|---|---|---|
| Policy announcement; read the statement and accompanying materials | 14:00 | 18:00 | 20:00 |
| Chair's press conference | 14:30 | 18:30 | 20:30 |
On a small screen, scroll the table horizontally.
The conversions use EDT, UTC−4, and CEST, UTC+2, as applicable on that date. They should not be reused unchanged for a winter meeting. The calendar is a schedule, not a guarantee of a particular market response.
The two moments matter because the initial headline contains less information than the full event. A target-range decision can look straightforward while the statement, projections or answers to questions change the interpretation of what comes next. A price move after 18:00 UTC and a reversal after 18:30 UTC can therefore belong to different information sets. Preserve both timestamps when reviewing the session.
At the July 29 meeting, the FOMC held the federal funds target range at 3.50%–3.75% by a 9–3 vote. The three dissenters preferred a quarter-point increase. The statement described inflation as still elevated and referred to supply shocks, including energy. This is a materially different starting point from assuming the September debate must be about how large a cut will be. Source: July 29 FOMC statement.
That historical vote does not establish September's outcome. It tells us what the committee decided and where disagreement existed at the previous meeting. Since then, additional data have arrived, and the September statement must be read on its own terms. We do not attach probabilities to outcomes because this article does not include a verified, timestamped futures-implied probability snapshot.
| Indicator | Latest value used here | Reference period / release |
|---|---|---|
| Federal funds target range | 3.50%–3.75% | July 29 FOMC decision |
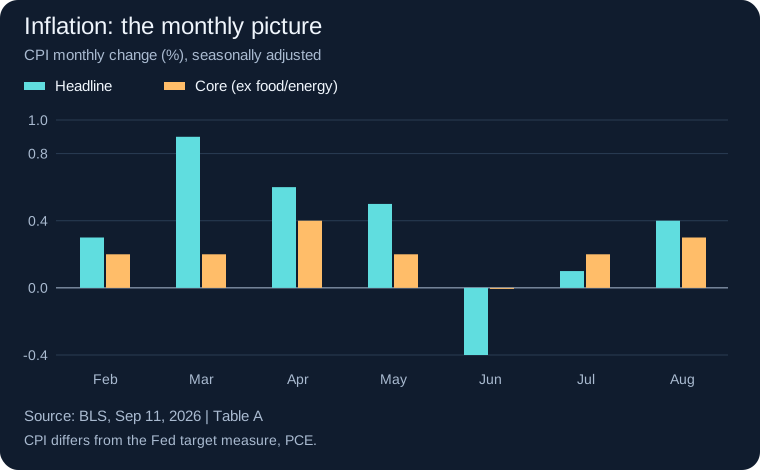
| Headline CPI | +0.4% month over month; +3.4% year over year | August; released September 11 |
| Core CPI, excluding food and energy | +0.3% month over month; +2.4% year over year | August; released September 11 |
| Nonfarm payroll employment | +162,000 | August; released September 4 |
| Unemployment rate | 4.1%, unchanged | August; released September 4 |
| Prior payroll revisions | June and July combined: +55,000 relative to the previous estimates | September 4 release |
On a small screen, scroll the table horizontally.
Sources: Federal Reserve, BLS CPI release, BLS employment release. CPI monthly changes are seasonally adjusted; the annual changes shown are not seasonally adjusted. Payroll figures remain subject to revision.

The inflation chart shows why it helps to separate the latest monthly reading from the annual rate. They describe different windows. A lower annual core reading can coexist with a stronger monthly reading; neither should be silently substituted for the other. Likewise, a single category's price shock and a broad increase in underlying inflation have different implications for an analyst's interpretation.
There is another measurement distinction: the Fed's longer-run inflation goal is expressed using the personal consumption expenditures price index, or PCE, rather than CPI. The CPI table is timely context for this preview, not a direct measurement of whether the Fed has achieved its target. Source: how the Fed evaluates inflation.
The employment report also contains more than its headline payroll number. The unemployment rate comes from a household survey, while nonfarm payroll employment comes from an establishment survey. Revisions to earlier payroll estimates alter the recent path even if attention centers on the newest month. Source: BLS employment report and methodology.
For an internally consistent comparison, we use Coinbase Exchange's LTC-USD and BTC-USD daily candles. The baseline is the close of August 31; the final observation is the close of September 13. The September 14 candle was still incomplete when the data were retrieved, so it is excluded from the charts and return calculations. LTC source data; BTC source data.

LTC moved from $48.544 to $53.727, while BTC moved from $78,562.74 to $76,799.85. The difference between their percentage returns is approximately 12.92 percentage points. The synthetic LTC/BTC ratio, calculated by dividing the two USD closes, increased 13.22%. That ratio return is different from subtracting the two USD returns because its denominator also changes.
The comparison supports a narrow conclusion: LTC outperformed BTC over this chosen window on this venue. It does not establish the cause. The period is short, the start date matters, and Coinbase is one market. These data do not identify who bought, prove institutional accumulation, or isolate an effect of the recent Core release. They also say nothing about what will happen after the Fed announcement.

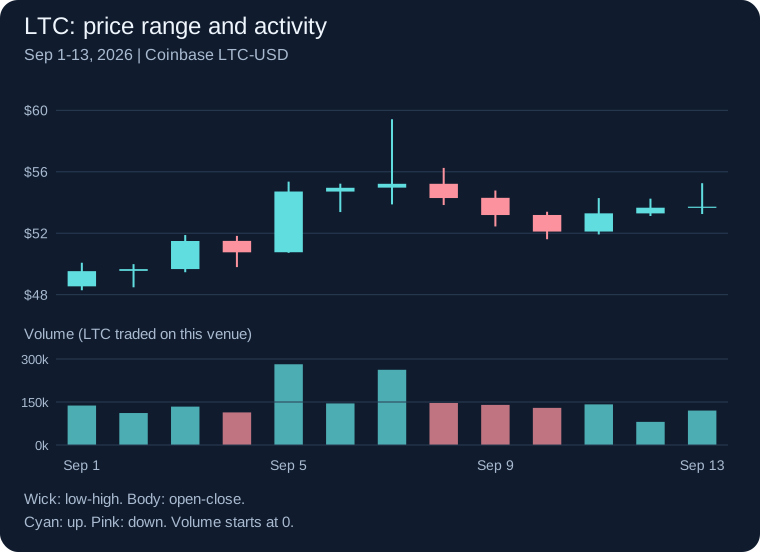
Within September 1–13, the observed LTC intraday range was $48.287–$59.422. Summed trading volume for those thirteen complete days was approximately 1.944 million LTC on Coinbase. These are descriptive window statistics. The high and low are not validated support or resistance levels, and the volume total is neither global exchange volume nor the value transferred on the Litecoin blockchain.
The candlesticks add information that daily closes omit. A market can finish near its opening price after a substantial move in both directions. That matters when evaluating the path through an event: a closing return and the largest intraday excursion answer different questions. Volume can provide context for participation on the observed venue, but it does not reveal the motives of counterparties.
| UTC day | LTC/USD | BTC/USD | LTC index | BTC index |
|---|---|---|---|---|
| Aug 31 | $48.544 | $78,562.74 | 100.00 | 100.00 |
| Sep 01 | $49.529 | $77,398.69 | 102.03 | 98.52 |
| Sep 02 | $49.661 | $77,307.36 | 102.30 | 98.40 |
| Sep 03 | $51.493 | $81,263.99 | 106.07 | 103.44 |
| Sep 04 | $50.757 | $79,675.12 | 104.56 | 101.42 |
| Sep 05 | $54.715 | $79,831.57 | 112.71 | 101.62 |
| Sep 06 | $54.958 | $80,339.13 | 113.21 | 102.26 |
| Sep 07 | $55.217 | $79,091.97 | 113.75 | 100.67 |
| Sep 08 | $54.291 | $78,447.11 | 111.84 | 99.85 |
| Sep 09 | $53.184 | $78,283.98 | 109.56 | 99.65 |
| Sep 10 | $52.108 | $76,536.55 | 107.34 | 97.42 |
| Sep 11 | $53.294 | $77,208.55 | 109.78 | 98.28 |
| Sep 12 | $53.661 | $77,262.85 | 110.54 | 98.35 |
| Sep 13 | $53.727 | $76,799.85 | 110.68 | 97.76 |
On a small screen, scroll the table horizontally.
Download the CSV with all daily OHLC, volume, index and ratio values.
The table below is an analytical framework. The target ranges in the hike and cut rows are arithmetic examples of a 25-basis-point move from the July setting, not forecasts or limits on what the committee could do. A basis point is 0.01 percentage point. The final column lists evidence to examine; it does not predict LTC's direction.
| Scenario | What would distinguish it | What to examine for LTC |
|---|---|---|
| Hold with a firmer inflation message | Range stays 3.50%–3.75%, but language or projections indicate more concern about persistence. | Whether yields and the dollar move higher; whether LTC weakens against BTC as well as USD. |
| Hold with a more balanced outlook | Same range, with greater emphasis on two-sided risks or less pressure for additional restraint. | Whether any initial LTC gain survives the press conference and the later UTC close. |
| Illustrative 25 bp hike | Range becomes 3.75%–4.00%; the explanation and projected path still matter. | Whether the action was already reflected in prices, and whether broader markets confirm the first reaction. |
| Illustrative 25 bp cut | Range becomes 3.25%–3.50%; distinguish confidence in disinflation from concern about growth. | Whether easier-rate expectations coincide with stronger risk demand or are outweighed by growth concerns. |
On a small screen, scroll the table horizontally.
The same numerical action can carry different information. A cut interpreted as a response to weaker activity could coincide with falling risk assets. A widely anticipated hike might produce little additional repricing. These examples explain why the surprise relative to prior expectations and the explanation of the future path can matter more than the direction of the rate change alone. They are conditional mechanisms, not a trading signal.
The economic projections deserve a separate reading. Compare the distribution and median of participants' rate projections with their growth, unemployment and inflation assessments, and note the projection horizon. Do not turn an individual projection or a median dot into a committee promise. For the comparison, use the official previous and newly released tables rather than a screenshot without a date. Reference: June 2026 projection materials.
Our analytical framework has three channels. First, a change in the expected return on cash and short-duration government debt can alter the opportunity cost of holding an asset that does not pay contractual interest. Second, changes in financing conditions can affect how much risk leveraged participants choose or are able to carry. Third, shifts in the dollar and broad risk sentiment can change how participants price USD-quoted assets.
None of these channels maps mechanically onto LTC. Litecoin is not an equity with a stream of corporate earnings to discount, so applying a stock valuation formula to it would be misleading. The relevant question is how changes in alternatives, funding and demand affect the market's willingness to hold the asset. Liquidity, positioning and crypto-specific developments can reinforce or overwhelm the macro impulse.
It is also useful to separate a move shared with Bitcoin from a move specific to Litecoin. If LTC/USD rises while LTC/BTC falls, Litecoin has gained in dollars but underperformed Bitcoin. If both rise, the relative picture is stronger, although the cause is still unproven. Our synthetic ratio uses matched USD closes; an actual LTC/BTC order book can differ because of trading conditions and timing.
This article does not estimate a historical Fed-event beta, fit a causal model or claim a stable correlation. Fourteen observations around a single forthcoming event would not justify those conclusions. The charts establish the pre-event context and can later serve as a documented baseline.
For an existing portfolio, the useful inputs are exposure, concentration, leverage if any, and the ability to tolerate an adverse move. A percentage move in LTC does not describe the effect on a mixed portfolio without position weights. Nor does a smooth daily chart describe execution conditions at the moment of an announcement. This is a framework for recording evidence and assessing exposure, not a personalized recommendation to transact.
On Litecoin.watch, use the price chart to inspect a chosen interval and the live rates page for current quotes. Their live values will differ from the fixed research snapshot here. Read the separate Core 0.21.5.8 analysis for network-software context; a software release and a monetary-policy decision are distinct events.
We retrieved the two Coinbase candle responses on September 14, 2026 at approximately 22:39:49 UTC. A candle's timestamp identifies the start of its UTC interval. We filtered the responses to August 31 through September 13 inclusive, sorted them chronologically and checked that both series contained all fourteen matching daily timestamps. The API can return observations outside the requested boundary, so the explicit filter is part of the method. Coinbase candle specification.
Calculations use the unrounded source numbers; display values are rounded afterward. Prices are venue-specific trades, not a consolidated index or executable quote for every reader. The downloadable CSV preserves the observations used here; the original public API may later return revised data. No missing day was interpolated, no partial day was presented as complete, and no forecast was added to the charts.
The economic figures use the dated BLS archives linked above, and the policy schedule and previous decision use Federal Reserve sources. The monthly inflation chart contains seven observations per series; it is contextual history, not an inflation forecast. This preview is fixed at its stated cutoff and should not be read as a report of the September decision after that decision takes place.
The meeting is scheduled for September 15–16. The September 16 policy event is listed at 14:00 EDT, or 18:00 UTC and 20:00 Warsaw time. The press conference is scheduled thirty minutes later.
No. The market response depends on what was expected, why policy changed, the projected future path and conditions in crypto markets. A cut associated with growth concerns can be interpreted differently from one associated with improving inflation.
The September 14 UTC daily candle was incomplete at retrieval. Using the last complete day keeps both assets on the same observation basis and avoids presenting an intraday price as a final daily close.
No. The Fed decision had not yet occurred at the research cutoff, and the charts do not isolate the effect of software news or any other driver. They show observed prices and relative performance over a disclosed interval.