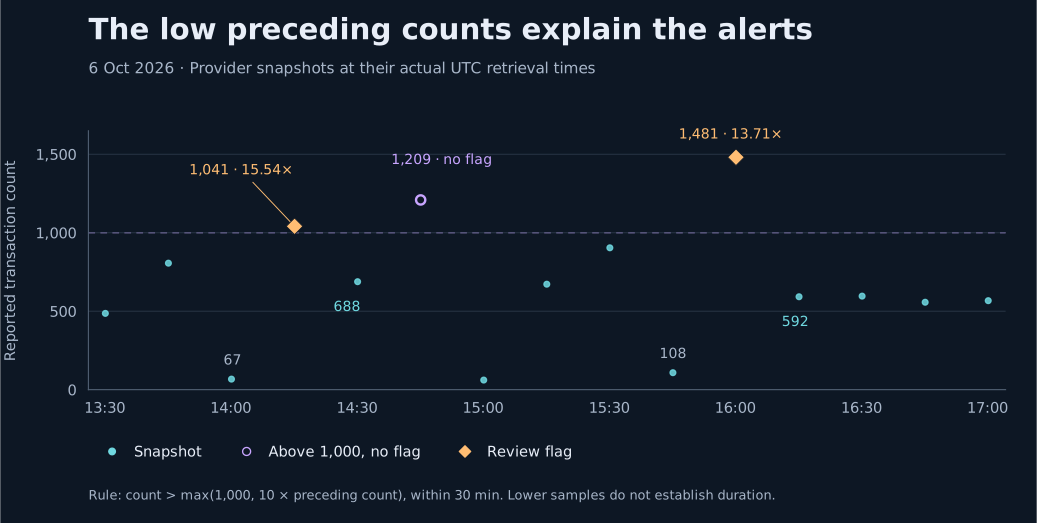
On October 6, our network monitor flagged two increases in the provider-reported Litecoin mempool count. At the first, the count rose from 67 to 1,041. At the second, it rose from 108 to 1,481. The next recorded count was lower in both cases. That sounds like a short burst followed by a recovery, until you look at the samples between the alerts: one reached 1,209 without triggering the same warning.
The apparent inconsistency comes from the rule. It looks for a count above 1,000 that is also more than ten times the preceding count. It detects a large relative jump from a low starting value. It does not decide whether the network is congested, whether a particular payment is stuck or whether a wallet should raise its fee.
What the records show
- The two flagged counts were 1,041 and 1,481, following counts of 67 and 108 respectively.
- An unflagged October 6 sample reached 1,209. The October 5 maximum was 1,271, also without a mempool-jump flag.
- Following samples were smaller, but that does not identify which transactions confirmed, disappeared or were replaced.
- The archive's average fee field describes transactions confirmed in a rolling 24-hour window. It is not a recommended fee rate for a new payment.
What we captured, and where the numbers came from
This report freezes the network archive from October 5 at 00:00 UTC through the October 7 18:30 UTC collection. The collector requests Blockchair Litecoin statistics and recent blocks on a 15-minute schedule. The mempool figures below are the provider's reported counts, not a transaction-by-transaction reconstruction from our own node.
The fixed window contains 267 valid statistics observations: 96 on October 5, 96 on October 6 and 75 in the partial October 7 day. Every elapsed quarter-hour slot has a statistics observation. We also retain one October 4 23:45 predecessor solely to evaluate the change rule at the beginning of the window. Consecutive capture gaps range from 899 to 901 seconds. Reported source timestamps are 1–50 seconds behind collection, with a median of 14 seconds.
Our extract preserves both collection times and the provider timestamps. The dates in the tables refer to collection times in UTC; the downloadable rows retain their original timestamp fields. A scheduled request, a valid statistics response and a valid block-window response are separate events. The archive keeps failed attempts in its collection log instead of turning them into zero activity.
| UTC day | Snapshots / elapsed slots | Block-window successes | Median count | Largest count | Samples above 1,000 | Jump flags |
|---|---|---|---|---|---|---|
| 2026-10-05 | 96 / 96 | 96 / 96 | 254.5 | 1,271 | 2 | 0 |
| 2026-10-06 | 96 / 96 | 95 / 96 | 238.5 | 1,481 | 6 | 2 |
| 2026-10-07 · through 18:30 | 75 / 75 | 75 / 75 | 255 | 819 | 0 | 0 |
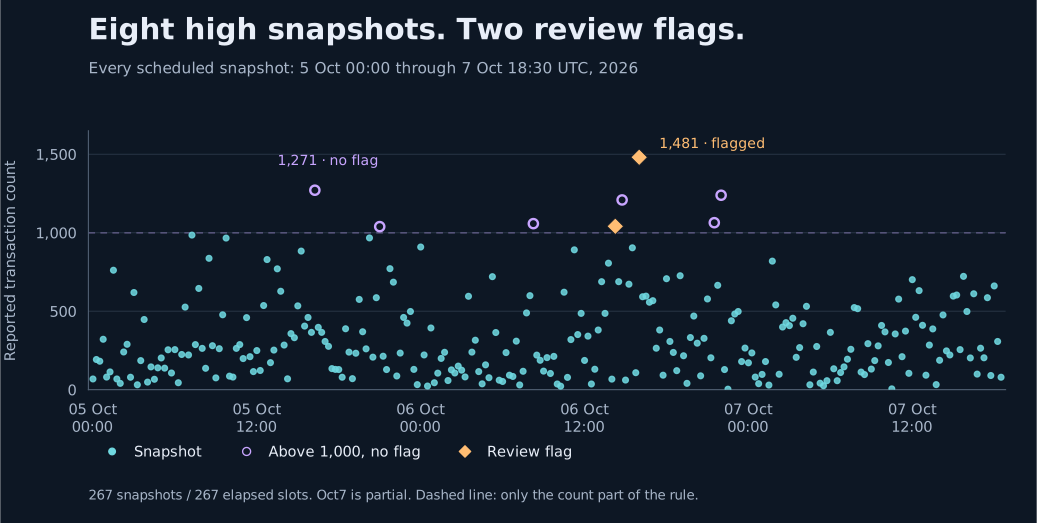
Two flags, with a larger unflagged count between them
The first flagged row was collected at 14:15:02 UTC on October 6. Its count of 1,041 was 15.54 times the preceding count of 67. The second was collected at 16:00:02, with 1,481 following 108: a 13.71-fold increase.
At 14:45:02, the archive recorded 1,209. That was larger than the first flagged count, but it followed 688. It therefore failed the tenfold condition. On October 5, the largest recorded count was 1,271; none of that day's samples triggered this rule.
| Captured UTC | Reported count | Previous count | Ratio to previous | Rule result |
|---|---|---|---|---|
| 14:15:02 | 1,041 | 67 | 15.54× | Flagged |
| 14:45:02 | 1,209 | 688 | 1.76× | Not flagged |
| 16:00:02 | 1,481 | 108 | 13.71× | Flagged |
The threshold in the collector is strict: current > max(1000, previous × 10). It also requires the preceding recorded observation to be no more than 30 minutes old. A count of exactly 1,000 would not qualify. Neither would an increase of exactly ten times. These details matter when reproducing the flags from the CSV.
This rule is useful for finding abrupt changes worth inspecting. It has a built-in dependence on the preceding value: a jump from a small starting count can be flagged while a sustained larger count remains unflagged. A page showing “no recent alerts” should therefore not be read as “the mempool was empty” or “all payments were fast.”
What happened in the following samples
The first count fell from 1,041 at 14:15 to 688 at 14:30. The second fell from 1,481 at 16:00 to 592 at 16:15. Those are reductions of 33.9% and 60.0% in the reported count. They describe differences between two observations, not the confirmation rate of the transactions counted in the first one.
After the first alert, the count rose again to 1,209 at 14:45; the first later sample below its pre-alert count of 67 was 61 at 15:00:02. After the second, the first later sample below its pre-alert count of 108 was 92 at 17:45:02. Those timestamps mark observed lower counts, not proven ends of continuous incidents or completed confirmation of the original transactions.
Even a sample below the earlier baseline would not prove that every transaction present at the alert had confirmed. The provider could see new arrivals, confirmations, replacements, evictions or changes in its own observation state between requests. Counts alone do not let us allocate those contributions.
Nor can we call a pair of 15-minute observations an exact 15-minute incident. The increase may have started between the provider timestamps recorded in successive snapshots. A decline may have happened before the next sample. Our charts plot the recorded points without filling in the unseen path between them.
A transaction count does not measure your waiting time
A count gives every reported transaction one unit. It does not tell us its size, fee rate, dependencies or why a miner might include it before another candidate. One large transaction and one small transaction each add one to the count, although their space requirements differ.
More fundamentally, these snapshots do not contain the transaction IDs present in the mempool at each observation. We cannot follow the 1,481 transactions from the second alert into later blocks. We cannot calculate their median wait, claim that a percentage confirmed within 15 minutes or identify a sender from the shape of the chart.
The site has a separate confirmation-time study for transaction-level observations. Its eligible cohort, observation boundaries and outages are reported separately. That dataset answers a different question from this provider count archive; combining the two labels would make the evidence appear stronger than it is.
The fee column is not the fee your wallet should use
Our frozen statistics extract also contains the provider's average confirmed transaction fee over the previous 24 hours. The collector converts that reported value to LTC before storing it. Specifically, the upstream field is average_transaction_fee_24h, divided by 100,000,000 to obtain avg_fee_ltc. The extract does not retain the underlying individual fees or precise provider inclusion denominator, so this report cannot independently reconstruct the upstream average.
| Alert capture UTC | Previous average · LTC | At alert · LTC | Next sample · LTC |
|---|---|---|---|
| 14:15:02 | 0.00005465 | 0.00005485 | 0.00005503 |
| 16:00:02 | 0.00005530 | 0.00005541 | 0.00005507 |
A 24-hour window changes as new confirmed transactions enter and older ones leave. Comparing the averages at 14:15 and 16:00 cannot isolate the fees of the pending transactions that triggered our alerts. A single expensive confirmed transaction can also move an average without showing what most users paid.
Keep three units separate: a total fee in LTC, a fee rate in litoshis per virtual byte, and the total fee of a candidate with a particular signed size. This extract does not contain a live distribution of pending transaction fee rates. It therefore cannot supply a personalised replacement fee or a current priority recommendation.
For a payment you are preparing now, check the source time and stated units in the fee tool, then inspect the actual wallet preview. For a payment already sent, use its public transaction ID in the transaction checker. The fee paid by that transaction is a different fact from the archive's rolling average.
The collection log matters as much as the chart
One block-window request failed at 13:15:01 UTC on October 6 while its statistics snapshot remained valid. The successful runs either side started at 13:00:01 and 13:30:01, a 30-minute gap. The next successful response retrieved all 11 intervening heights, 3,190,548 through 3,190,558. The frozen block extract contains 1,512 consecutive heights, 3,189,722 through 3,191,233, without an internal height gap. Blocks were selected by their header timestamps and capped at the last selected observed tip height. The export was retrieved after the statistics cutoff: checked_at records can therefore be later than 18:30 UTC. This is a frozen export of the archive as retrieved, not a claim that its entire block table was already present at every earlier observation.
At both alert captures, the separate BlockCypher comparison matched the Blockchair hash at the same height. Across the context window, 263 comparisons matched and four had no overlapping recorded height. These checks concern block tips, not mempool counts. The archive also retains one earlier hash revision at height 3,190,488, recorded at 10:15:04 UTC on October 6. We preserve that revision without treating it as a cause of the later count jumps.
The collection status belongs to our pipeline. A failed provider request is not evidence that Litecoin stopped producing blocks. Conversely, a successful request is not an independent certification of every value returned by the provider.
We kept these records in the package so that someone checking the report can distinguish a missing block-window response from a missing statistics observation. A clean-looking graph made by dropping those distinctions would be easier to read and less useful to verify.
How to inspect the same observations
- Download the frozen research package rather than relying on the changing live archive.
- Check the file hashes against SHA256SUMS.txt. The README describes the extract, timestamp fields and reproduction commands.
- Open the observation CSV and sort by the recorded collection time. Keep the preceding row when checking an alert; testing only the flagged row omits half the rule.
- Recalculate the ratios and the strict threshold. Read the collection log alongside the statistics and block files.
- Run the included offline verifier and analyzer to reproduce the tables. That checks the calculations against the frozen files; it does not independently verify the upstream provider's historical observations.
Direct files: observation rows · CSV, event comparison · CSV, daily summary · CSV, collection attempts · CSV, computed results · JSON.
What to do when a network chart looks alarming
Start with the label and timestamp. Is the figure a pending transaction count, a count of transactions already confirmed over the previous 24 hours, or a fee rate? Is it current, a frozen snapshot or a delayed response?
Then ask what you actually need to establish. A sender needs to know whether the intended transaction was broadcast and included. A recipient needs to inspect the transaction, the expected output and the confirmation requirement. A researcher needs a defined observation window and enough data to test the proposed explanation. One red marker on a count chart does not establish all three.
Our October 6 markers identified two abrupt changes correctly under the published rule. The useful result of inspecting them is the distinction between a relative jump and a large queue. We found no basis in these count snapshots for attributing the events to an attack, a particular service or a specific group of users.
Sources, cutoff and limits
The evidence cutoff is the October 7, 2026 18:30 UTC collection. The report uses our frozen extracts from the network archive, its collection log and review flags, and the collector's recorded field definitions. The upstream field definitions are documented in the Blockchair API documentation. Our network methodology and review thresholds explain what is collected and what a flag means.
The study covers reported aggregate statistics at scheduled intervals. It does not include a transaction-level mempool history, pending fee-rate distribution, an independent node comparison of mempool counts at those historical moments or a causal explanation for the increases. October 7 is a partial UTC day. Neither this report nor a successful arithmetic check is an independent external review of the data provider.
Research and drafting were assisted by AI, with a frozen data extract, reproducible calculations and disclosed scope. The byline identifies the responsible editor. The hero image is a generated conceptual illustration of accumulated work; it is not a photograph of Litecoin infrastructure or a record of the observed events.