


Your actual Litecoin return: fees, spreads and currency effects
A reproducible guide to LTC profit after costs: follow a $1,000 round trip, calculate break-even, separate USD/EUR/PLN effects and reconcile partial sales.
On this page
Reviewed 18 September 2026. All prices, FX rates and charges in the worked examples are hypothetical. They are not current market quotes or a provider's fee schedule. Calculations use unrounded intermediate values; displayed money is rounded. The hero is an AI-generated editorial illustration.
A chart says Litecoin rose 20%. Your bank balance says you made less. Both can be correct: the chart tracks a reference price, while your result depends on how much cash left your account, how much LTC you actually received, and how much cash eventually came back.
This guide builds one complete, reproducible example. It then separates the USD result from the effect of your home currency, explains partial sales, and shows what to record so that a portfolio display can be reconciled with real transactions.
1. Decide which result you are measuring
Start by naming the quantity. “Profit” can mean several different things, and a number without a definition is difficult to audit.
| Measure | What it answers | What it leaves out |
|---|---|---|
| Reference-price return | How did a quoted LTC price change? | Your fills, fees and funding route |
| Net cash return | What came back after all included cash costs? | Any costs or taxes explicitly outside the model |
| Unrealized gain/loss | How does a current valuation compare with the remaining cost? | An actual sale; often future exit costs |
| Home-currency return | What happened to purchasing capital measured in USD, EUR or PLN? | Inflation unless explicitly adjusted |
For a single purchase followed by a complete sale, with no other deposits or withdrawals, the cleanest measure is net cash received minus total cash paid. Divide that profit by the total cash paid to calculate the simple return. Do not divide by the amount that reached the exchange after a deposit fee: that would leave a real cost outside the denominator.
For an open position, label the result as an estimate. A midpoint quote values the position, but does not establish what a buyer will pay for its entire size. An estimated liquidation value should also include the expected sell-side fees and withdrawal costs.
2. Build a ledger before using a percentage
Record each execution, not just the price displayed on a chart. Useful fields are the timestamp and timezone, trading pair, LTC quantity, executed price, fee amount, fee currency, deposits, withdrawals, and any FX conversion used to fund or cash out the trade.
The distinction matters because providers can combine charges differently. Coinbase, for example, describes a spread in simple trades and separates that product from order-book trading. That is evidence about its own products, not a universal fee schedule. Check your chosen service's final preview and transaction statement. Source: Coinbase pricing and fee disclosures.
Do not count the spread twice. If the statement says you bought LTC at $80.24, use $80.24 as the execution price. You can compare it with an $80 reference price to explain execution cost, but must not then add another 0.3% charge to the same purchase. The example below separates these components only to show where they enter the arithmetic.
3. A complete $1,000 example: a 20% rise becomes 17.85%
Assume one investor starts with $1,000. They pay a $2 funding fee, buy LTC, withdraw it to their own wallet, later send the remaining LTC back to a trading venue, sell all of it, and withdraw the cash. No borrowing, staking proceeds, taxes or account interest are included.
| Input | Value | Convention |
|---|---|---|
| Starting cash | $1,000.00 | All cash paid by the investor |
| Funding charge | $2.00 | Deducted before the purchase |
| Entry reference price | $80.00 per LTC | Not a current price |
| Entry execution adjustment | +0.30% | Buy at reference × 1.003 |
| Purchase commission | 0.40% | Charged in USD on executed notional |
| Exchange withdrawal | 0.01000000 LTC | Deducted from LTC bought |
| Later wallet network fee | 0.00000200 LTC | Separate send back to the trading venue |
| Exit reference price | $96.00 per LTC | 20% above the entry reference |
| Exit execution adjustment | −0.30% | Sell at reference × 0.997 |
| Selling commission | 0.40% | Deducted from executed sale proceeds |
| Final cash withdrawal | $1.50 | Deducted after selling |
The 0.3% entry adjustment means buying at $80 × 1.003 = $80.24. The separate trading fee is 0.4% of the executed purchase notional, paid from the same $998 available balance. Therefore:
LTC bought = (1,000 − 2) ÷ (80 × 1.003 × 1.004)
           = 12.3881344016 LTC

LTC available for sale = LTC bought − 0.01 − 0.000002
                      = 12.3781324016 LTC

Net sale cash = LTC available × 96 × 0.997 × 0.996 − 1.50
              = $1,178.496865...

Net profit = $1,178.496865... − $1,000
           = $178.496865...

Net return = $178.496865... ÷ $1,000
           = 17.8496865...%
The exchange withdrawal charge of 0.01 LTC and the later wallet network fee of 0.000002 LTC represent two separate events. The network fee is not added again to the exchange's withdrawal charge. Those amounts are illustrative; neither is a claim about the current cheapest route.
| Step | Amount | Interpretation |
|---|---|---|
| Cash available after funding | $998.00 | Starting cash less funding charge |
| Executed purchase notional | $994.02 | LTC bought × $80.24 |
| Purchase commission | $3.98 | Together with notional, consumes $998 |
| LTC bought | 12.38813440 LTC | Before quantity deductions |
| LTC available to sell | 12.37813240 LTC | After exchange withdrawal and later network fee |
| Executed sale proceeds | $1,184.74 | Before selling commission |
| Selling commission | $4.74 | 0.4% of executed sale proceeds |
| Final cash received | $1,178.50 | After selling commission and $1.50 withdrawal |
| Net cash profit | $178.50 | Final cash minus original $1,000 |
| Net return | 17.85% | Profit divided by original cash outlay |
This is a continuous arithmetic model. Actual exchanges and wallets round quantities to supported precision, and a real statement may debit the trading fee in LTC or another asset rather than USD. Reconcile the exact credited quantity and fee currency instead of forcing a platform's statement into a different charging convention.
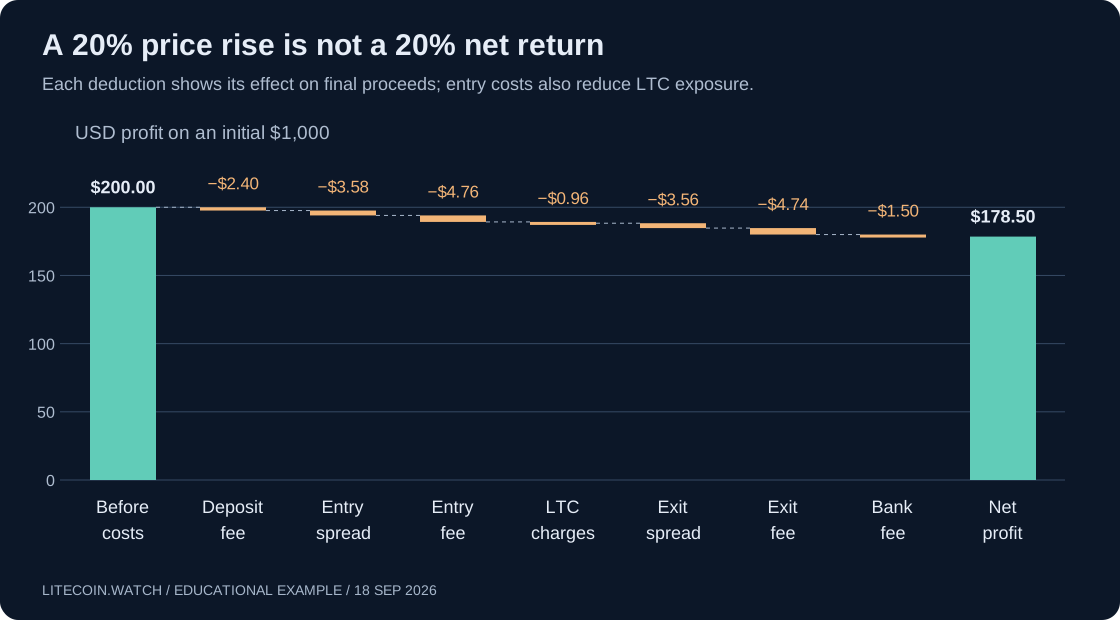
The chart starts at the $200 profit that a frictionless purchase at $80 and sale at $96 would produce. Each step measures the reduction in final proceeds. For example, the $2 funding charge reduces the amount invested and therefore removes $2.40 of hypothetical sale value after a 20% price rise. It is still a $2 cash charge; the additional $0.40 is foregone exposure in this example. The bars are not a list of fee invoices.
4. Calculate the price needed to break even
The original entry reference price of $80 is not the break-even price. The sale must recover the original $1,000 after the modeled exit spread, selling commission and cash withdrawal charge.
Break-even exit reference price
  = (initial cash paid + final cash withdrawal charge)
    ÷ [LTC available for sale × (1 − exit adjustment) × (1 − sell fee)]

  = 1,001.50 ÷ (12.3781324016... × 0.997 × 0.996)
  = $81.4781826... per LTC
Under these assumptions, the reference price needs to rise approximately 1.85% just to recover the original cash. This is a scenario threshold, not a forecast or an executable limit price. A different fee tier, order size, spread, FX rate or withdrawal route changes it.
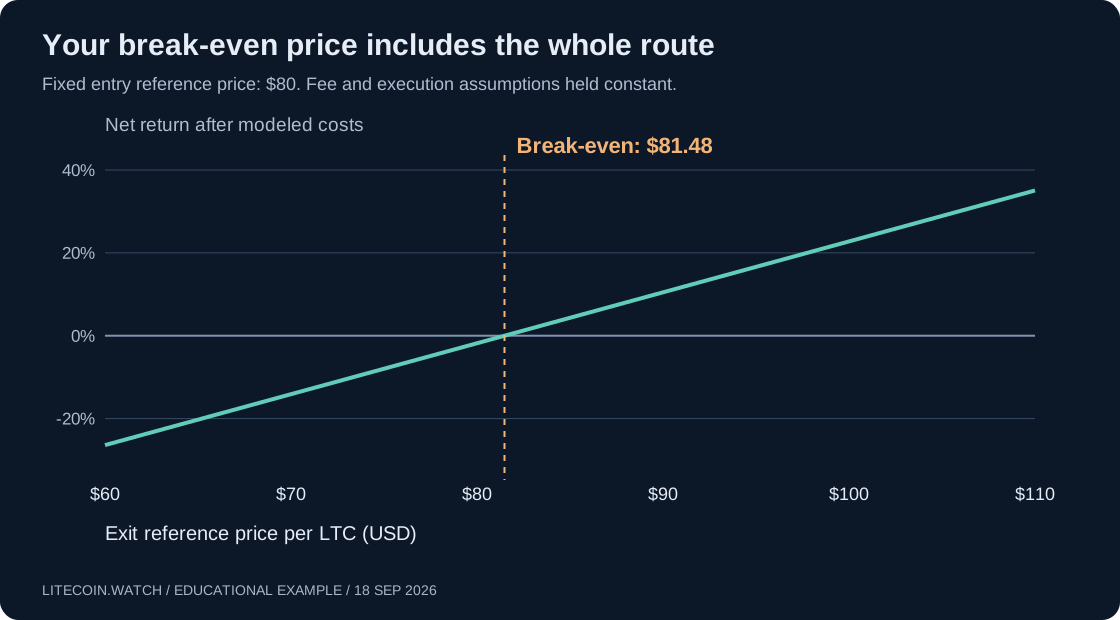
Percentage costs scale with trade size; fixed charges do not. A $2 charge is 2% of $100 but 0.2% of $1,000. This is why a route that looks reasonable for a large transfer may be expensive for a small recurring purchase. Compare the complete route for the amount you actually intend to use.
5. Your USD, EUR and PLN returns can differ
Suppose the USD trade produces the same $1,178.496865... in each scenario. A USD-based investor compares that amount with $1,000. Someone who funded the trade with another currency must also account for how many units of that currency were paid for each dollar at entry and received for each dollar at exit.
Let X mean home-currency units per USD, such as 4.00 PLN per USD. Using consistent quote directions:
Home-currency return
  = (net USD proceeds × exit X) ÷ (initial USD outlay × entry X) − 1

Equivalently:
1 + home-currency return = (1 + net USD return) × (exit X ÷ entry X)| Currency | Entry / exit units per USD | Original cash | Final cash | Return |
|---|---|---|---|---|
| USD | 1 / 1 | 1,000.00 | 1,178.50 | 17.85% |
| EUR | 0.92 / 0.88 | 920.00 | 1,037.08 | 12.73% |
| PLN | 4 / 3.8 | 4,000.00 | 4,478.29 | 11.96% |
| PLN | 4 / 4.2 | 4,000.00 | 4,949.69 | 23.74% |
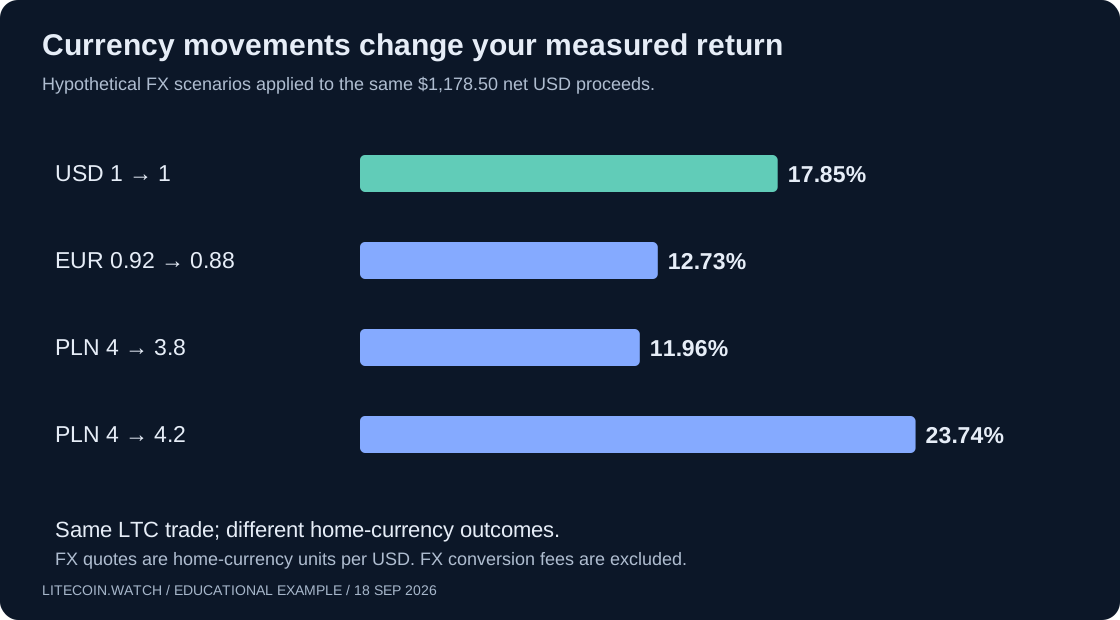
The two PLN rows deliberately use opposite currency moves. A fall from 4.00 to 3.80 PLN per USD reduces the PLN value of the same dollars. A rise to 4.20 increases it. For the EUR row, 0.92 and 0.88 are EUR per USD, not the usual EUR/USD market quotation. If a source gives USD per EUR, invert it first.
These FX scenarios exclude FX conversion spreads and commissions. For a real result, the strongest inputs are the actual amounts debited and credited in your home currency, including those charges. If you traded LTC directly against PLN or EUR, start with that pair's actual execution records rather than inventing USD conversions that never occurred.
6. Partial sales: cash profit and remaining value are separate
A portfolio with multiple purchases needs an allocation convention for realized profit. Consider this simple USD ledger: buy 5 LTC at $80 plus a $2 fee; buy another 5 LTC at $100 plus a $2 fee; sell 4 LTC at $110 and pay a $2 selling fee. Mark the remaining LTC at $110.
| Item | Calculation | USD amount |
|---|---|---|
| First purchase cost | 5 × 80 + 2 | 402.00 |
| Second purchase cost | 5 × 100 + 2 | 502.00 |
| Net proceeds from selling 4 LTC | 4 × 110 − 2 | 438.00 |
| FIFO cost allocated to sale | 4 × 80.40 | 321.60 |
| Realized profit | 438 − 321.60 | 116.40 |
| Remaining cost | 1 × 80.40 + 5 × 100.40 | 582.40 |
| Remaining reference value | 6 × 110 | 660.00 |
| Unrealized profit | 660 − 582.40 | 77.60 |
| Total profit at the reference mark | 116.40 + 77.60 | 194.00 |
Under a FIFO bookkeeping convention, the first purchase has a cost of $402, or $80.40 per LTC. The 4 LTC sold receive $321.60 of that cost. Net sale proceeds of $438 therefore produce $116.40 of realized profit. The remaining cost is $582.40; its $660 reference value produces $77.60 of unrealized profit. Together they equal $194.
Check the same total without allocating lots: $438 received + $660 still held − $904 paid = $194. The total economic result is consistent; the realized/unrealized split depends on the convention. Future selling costs are not included in the $660 mark.
FIFO here is an explanatory accounting convention, not a statement about which tax method you are required or permitted to use. A tax return can have different rules for allowable costs, currencies, valuation times and disposals. Keep the original records.
7. Common mistakes that make returns look better than they are
- Using the market-chart price instead of your fill. A quote from another venue or another time can overstate execution quality.
- Ignoring costs paid in LTC. A withdrawal charge reduces the quantity available to sell, even if no USD fee appears.
- Treating a transfer between your own wallets as a purchase or sale. The transfer changes location; its fee can reduce your holdings. It does not create a market gain by itself.
- Converting every historical cost with today's FX rate. That displays a USD ledger in another unit; it does not reconstruct what your original EUR or PLN funding cost.
- Calling a deposit “profit”. Adding new money raises portfolio value without creating investment performance.
- Reporting unrealized value as withdrawable cash. The remaining order-book depth, fees and banking route still matter.
With irregular deposits and withdrawals, one starting balance and one ending balance are insufficient for a meaningful performance percentage. Keep dated external cash flows and state whether a calculation uses a time-weighted or money-weighted method. The simple return in this guide applies to the explicitly defined single-outlay scenario; it is not a substitute for either method.
8. Use the site's tools without losing the audit trail
The LTC calculator is useful for reference conversions. The fee tracker helps separate network fees from service charges. Neither represents a guaranteed exchange fill.
Our portfolio tracker records purchases and sales in a USD ledger with fee fields and a FIFO calculation. Its alternative display currencies convert USD summary values using the current available cross rate; they do not reconstruct historical home-currency cash flows. Keep an additional dated FX ledger when that distinction matters. A network or exchange withdrawal paid in LTC also needs an explicit quantity reconciliation; do not invent a market sale merely to force a balance to match.
After reconciling your cost, you can use the price-alert setup guide to monitor a reference threshold. An alert neither sells the asset nor locks in the computed return.
9. Download the data and reproduce the result
The downloadable files contain the full-precision worked-example outputs used by the charts: cost effects CSV, exit-price scenarios CSV, and FX scenarios CSV. They contain illustrative data, not a backtest. The equations and assumptions above are sufficient to reproduce them in a spreadsheet.
For a final reconciliation, compare the original cash debit, the credited LTC quantity, each later quantity deduction, executed sale proceeds and final bank credit. If those do not reconcile, investigate the difference before relying on the percentage.
Frequently asked questions
If LTC rises 20%, why is my return not exactly 20%?
Because you may have bought less LTC after entry costs, received a different execution price and paid costs to sell or withdraw. Your reporting currency can introduce an additional change.
Should I subtract a spread from my actual execution price?
No. The execution price already reflects what you paid or received. A separate spread calculation can explain the difference from a reference quote, but subtracting it again double-counts that effect.
Is the break-even value shown here a live signal?
No. It is a mathematical result for a hypothetical route. Replace every input with your records and relevant exit assumptions before using the model.
Sources, methodology and scope
The numerical model, CSV files and SVG charts are original calculations by Litecoin.watch, checked with decimal arithmetic and independent reconciliation of the cash flows. Provider-specific fee conventions are illustrated by Coinbase's official disclosure; the article does not use or recommend its current fee rates. Site-tool behavior was reviewed against the portfolio and alert implementation on 18 September 2026. This guide measures nominal cash returns before tax; it does not calculate an inflation-adjusted “real return”.



Track Litecoin in real time
Rates for 30+ currencies. Check each tool for its latest source timestamp.
Open dashboard