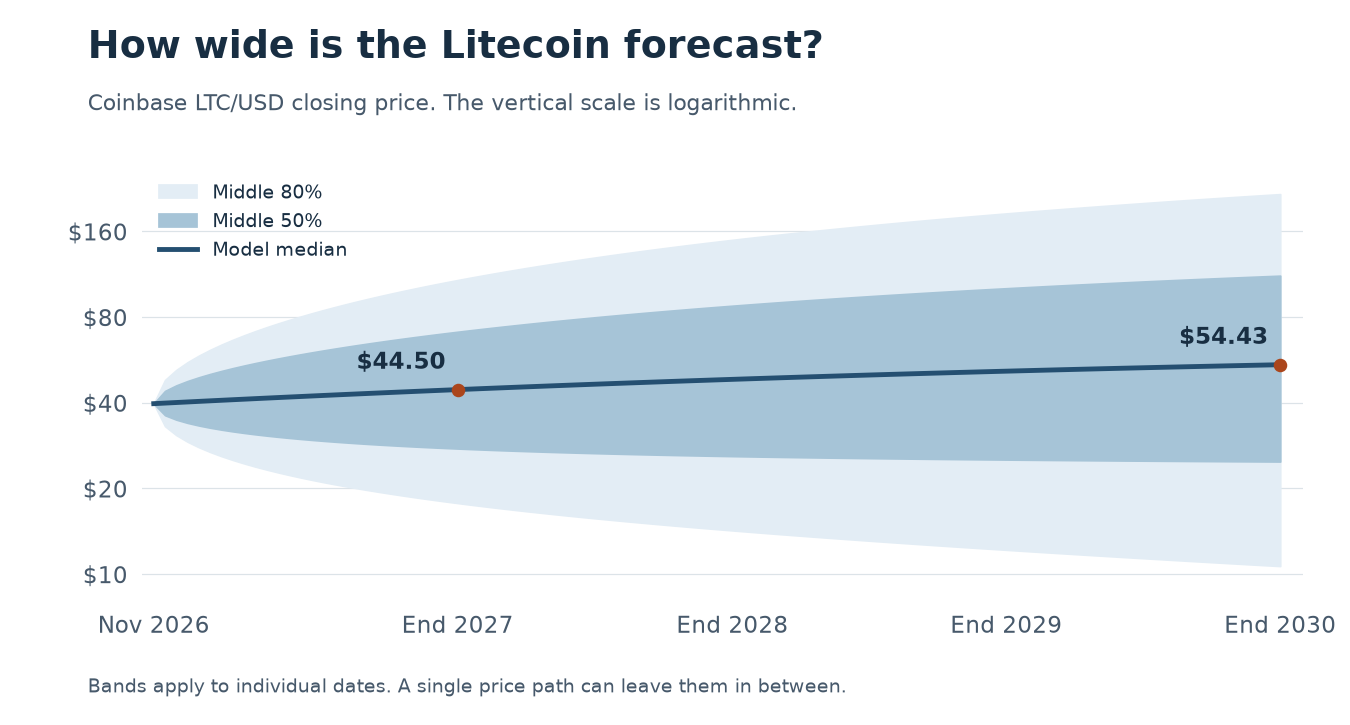
Our forecast for one is $44.50 at the end of 2027 and $54.43 at the end of 2030. Each figure is the median of a forecast that gives two models equal weight, starting from a Coinbase close of $39.723 on 21 November 2026. The middle 80% of modeled outcomes spans $17.78 to $107.97 for 2027 and $10.68 to $216.36 for 2030.
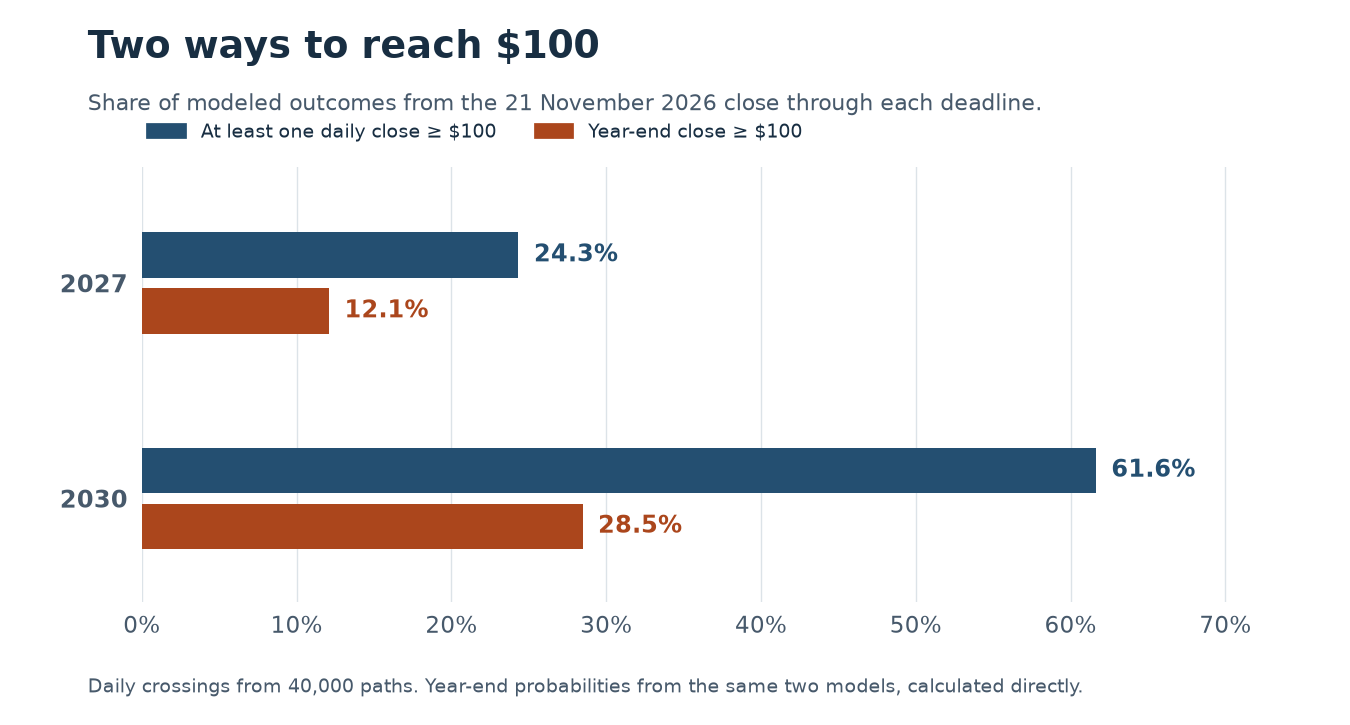
Take the question people actually ask. Could LTC get back to $100? We estimate a 24.3% chance of at least one daily close at $100 or higher between the cutoff and the end of 2027. Ask for $100 on the last day of 2027 and the estimate falls to 12.1%. Extend the deadline to the end of 2030 and those figures become 61.6% and 28.5%, respectively. All four numbers depend on the model and on LTC continuing to trade.
One historical result tempers that upside. In 58 overlapping windows as long as our 2027 forecast, ten contained a daily close at twice the starting price. None finished at twice the starting price. That is a different hurdle from $100 at today’s price, and some windows caught the same rally. It is still a good illustration of how two people can remember the same and disagree about whether a price call worked.
What Litecoin.watch forecasts for each December close
The outcome is the last price in the Coinbase LTC-USD daily candle dated 31 December of the relevant year, measured in US dollars. A candle runs on UTC. We allowed 405 daily steps to the first deadline and 1,501 to the second. The last completed starting candle closed at $39.723 on Coinbase and $39.748 on Bitstamp, a difference of two and a half cents. We use Coinbase throughout so a switch of exchange cannot change the result halfway through the test. Coinbase candle documentation and dated source requests.
| Settlement | Median | Middle 50% | Middle 80% | Chance of finishing above $39.723 |
|---|---|---|---|---|
| 2027 | $44.50 | $27.63 to $71.07 | $17.78 to $107.97 | 56.4% |
| 2030 | $54.43 | $24.87 to $111.86 | $10.68 to $216.36 | 61.1% |
Half the modeled closes lie on either side of the median. One in ten lies below the bottom of each 80% interval and one in ten above the top. The model gives 2030 a higher central estimate and a lower downside boundary. More time allows a recovery from a depressed starting price. It also allows a bad run to compound for longer. Both show up in the numbers.
The $100 question changes when you put a date on it
Imagine a path that closes at $104 in August 2027 and at $82 on New Year’s Eve. Someone who predicted at least one $100 close was right. Someone who predicted a triple-digit year-end close missed. A screenshot from August would make the two forecasts look identical. Here is how often that distinction mattered in our numerical experiment.
| By the end of | At least one $100 close | Final close at least $100 | Of paths reaching $100, share ending below it |
|---|---|---|---|
| 2027 | 24.3% | 12.1% | 49.9% |
| 2030 | 61.6% | 28.5% | 53.0% |
We generated 40,000 paths and followed each one through both deadlines. By the end of 2030, 24,654 had recorded a daily close of at least $100. Of those, 13,078 finished below $100. The year-end column uses the exact distribution implied by our two models. The simulation’s independent numerical cross-check for that same 2030 endpoint was 28.94%, versus 28.48% calculated directly. The crossing and conditional percentages use the paths themselves. The candles’ intraday highs could register additional touches that this experiment does not count.
Downside, upside and the $1,000 extreme
A scenario earns its place by specifying what would settle it. We divided year-end prices into five non-overlapping bands. The first row includes every positive closing price below $20. The last includes every price from $200 upward, so $333 and $1,000 are narrower events inside it. Rounded entries can sum to 100.1%.
| USD per LTC | End of 2027 | End of 2030 |
|---|---|---|
| Below $20 | 13.1% | 20.0% |
| $20 to below $50 | 43.5% | 27.0% |
| $50 to below $100 | 31.3% | 24.6% |
| $100 to below $200 | 10.6% | 17.2% |
| $200 or higher | 1.5% | 11.3% |
Below $20. This would mean losing roughly half the starting price or more. The house probability is 13.1% in 2027 and 20.0% in 2030. The long-horizon figure is particularly sensitive to whether Litecoin tends to recover from prolonged weakness. Taken separately, the two models assign about 32% and 8% to that same 2030 downside event.
$200, $333 and $1,000. The house assigns an end-2030 probability of 11.3% to at least $200, 5.0% to at least $333 and about 0.7% to at least $1,000. For end-2027, the $1,000 result is below 0.01%. There is too little independent history to distinguish precisely between very small tail probabilities. The arithmetic hurdle is easier to defend. Going from $39.723 to $333 by end-2030 takes about 67.8% annualized growth. Reaching $1,000 by then takes about 119.2% per year, compounded over the full 1,501 days.
There is also a risk outside these bands. Both equations produce a positive price and assume a functioning venue. To see the effect of that choice, suppose someone separately assigned a hypothetical 10% probability to permanent economic failure with zero recovery before 2030, and kept our current distribution for the other 90%. Their probability of ending above $100 would fall from 28.5% to about 25.6%. The 10% is an illustrative input. A missing Coinbase quote at settlement would be a data exception requiring disclosure, a different situation from zero economic value.
What other forecasters actually predicted
The easiest way to manufacture agreement is to put unrelated numbers under one column marked “2030.” We went back to each publisher, recorded the dated edition or capture, and kept its original price definition. All figures below are US dollars. None of these external targets entered our model.
| Source and edition | 2027 | 2030 | What the figure measures |
|---|---|---|---|
| CoinPriceForecast, 1 Nov 2026 archive | $82.66 | — | End of 2027. We used the archived entry for that date. |
| TokenSonar, 21 Nov 2026 revision | $46.60 | $54.01 | November base cases. Both end a month ahead of our December targets. |
| PrimeXBT, table read 22 Nov 2026 | $49.32 | $41.05 | Full-year averages. A late rally could lift the December close while leaving this average lower. |
| Finder, October 2025 survey | — | $333 | Mean year-end target from a survey of 18 fintech specialists. The survey predates this forecast by more than a year. |
CoinPriceForecast’s dated wording was “close the year at $82.66.” TokenSonar wrote “$46.60 by Nov 2027.” The difference goes beyond a month. TokenSonar’s previous weekly edition had put its rolling 12-month target at $56.48 off a $48.34 starting price. Its new edition pairs $46.60 with $39.35. The dollar target fell about 17.5%, while implied upside rose from 16.8% to 18.4%. Even the settlement date moved forward a week. Recording just the change in the target would give the wrong impression of how the published view changed. Dated comparison records and short source excerpts.
Finder wrote that the panel expected LTC to “rise to $333 by 2030.” Its year-end table also lets us check one completed call from the same survey. The mean 2025 target was $159. Coinbase closed 31 December 2025 at $76.73, or 51.7% below that target. One miss cannot establish how accurate the whole panel is. It does make clear why we would treat $333 as an opinion with an owner and a date. It sits close to the 95th percentile of our separate 2030 distribution. Finder’s year-end table and our dated Coinbase closes.
Why our two models disagree
Model one assumes no trend in log price. Each day adds a random return whose scale comes from the most recent 730 daily log returns. Their annualized standard deviation was 72.1%. The median remains at $39.723 at either deadline. Individual paths can run far above or below that price. Using a zero average change in log price fixes the median price in this model. The arithmetic mean of all simulated prices can be much higher because a few very large outcomes pull it up.
Model two allows a slow recovery toward a historical level. The geometric mean of the last 1,460 closes was $76.35. This version halves the gap in log price to that level every 730 days, on average, using the same daily shock size. The anchor stays fixed for each forecast. Those assumptions produce medians of $48.94 in 2027 and $65.25 in 2030. The historical average is a modeling choice. If Litecoin loses demand permanently, an equation pulling it back toward older prices will be too optimistic.
We give each model half the weight and take the median of the combined distribution. We keep a simulated path in the same model throughout its life. For readers who want to change the assumptions, the daily equations, both weights, the random seeds and all inputs are public. The analytic year-end calculation uses the distribution of log price in each model. It does not need a simulation to assign a probability to a final price. Model equations and replay code.
What happens when we use actual sequences of market returns? As a challenge to the assumption of independent normally distributed daily shocks, we drew 28-day runs from the latest 730 historical returns, with replacement. We centered the returns so the past two years’ directional drift was not silently imposed on the next four. This preserves some stretches of calm, turbulence and reversals inside each sampled . We kept the two price rules and their weights.
| Event | 2027 independent shocks | 2027 historical blocks | 2030 independent shocks | 2030 historical blocks |
|---|---|---|---|---|
| At least one $100 daily close | 24.3% | 17.2% | 61.6% | 55.7% |
| Final close at or above $100 | 12.1% | 8.2% | 28.5% | 25.0% |
On the shorter horizon, changing only how the shocks arrive moves the year-end $100 estimate from about 12% to about 8%. With 40,000 independent simulated paths, the largest possible Monte Carlo standard error for one proportion is about 0.25 percentage points. Running another million paths would narrow simulation noise. It would do little to resolve the four-point disagreement about the market process. The block model itself can only reuse conditions present in its sample.
How the forecasts held up when we rolled the clock back
For every eligible month-end, we hid all later prices, calculated the two forecasts from the information available then, and compared them with the single close exactly 405 or 1,501 days later. We started the price history on 1 January 2017. The four-year warm-up makes 31 December 2020 the first eligible month-end. This is a retrospective rolling test of rules specified for this article. A genuinely live record begins with this publication.
| Horizon and model | Closes in the middle 80% band | Median error factor | Brier score for a rise |
|---|---|---|---|
| 405 days, no trend | 57 of 58 | 1.47× | 0.250 |
| 405 days, slow reversion | 58 of 58 | 1.36× | 0.211 |
| 405 days, house blend | 57 of 58 | 1.40× | 0.230 |
| 1501 days, no trend | 22 of 22 | 1.80× | 0.250 |
| 1501 days, slow reversion | 22 of 22 | 1.33× | 0.159 |
| 1501 days, house blend | 22 of 22 | 1.33× | 0.198 |
An error factor of 1.40 means the median price error was a factor of 1.40, counting a forecast too high and one too low symmetrically in log space. For the Brier score we squared the difference between the predicted probability of a rise and the observed result, coded as one or zero. A perpetual 50% guess scores 0.250. The house scored 0.230 at 405 days and 0.198 at 1,501 days. Better scores in this sample justify showing the comparison. They fall well short of establishing an enduring forecasting edge.
The central 80% house band captured 57 of 58 shorter outcomes and all 22 longer ones. That unusually high coverage came with wide intervals. And the starting dates overlap heavily. At most five non-overlapping 405-day outcomes and one non-overlapping 1,501-day outcome fit among these origins. Twenty-two rows for 2030-length forecasts represent many views of substantially the same market history. They cannot validate a 0.7% tail probability.
There is a sharper check on bullish forecasts. At the shorter horizon the models together assigned an average 20.4% probability of ending at twice the starting price. Zero of 58 month-end starts delivered that terminal result. Ten contained a doubling along the way. At the longer horizon the mean forecast probability was 29.4%, with zero terminal doubles in 22 starts and eight windows containing a daily-close double. This sample gives a reason to be skeptical of the modeled upside. Its overlap also precludes treating those outcomes as 80 independent failures. Inspect every forecast origin, probability and observed close.
What changed since our October 2027 outlook?
Our 22 October article set out a $60–$120 working range for the end of 2027. It was editorial judgment tied to six scenarios. The Coinbase starting close in that research was $61.521. By 21 November the price was down 35.4%. A $100 close had gone from about 1.63 times the earlier starting price to 2.52 times the new one. The current model puts 25.8% of the 2027 closing distribution inside the original $60–$120 band. The October call stays on the record and has the same future settlement date. Read the original six-scenario outlook.
A recovery has two ways to show up in the dollar quote. The same-day Coinbase closes of $60,086 for bitcoin and $39.723 for litecoin imply about 0.0006611 BTC per LTC. If bitcoin were to trade at $100,000 and that ratio held, the implied Litecoin price would be about $66.11. To get $100 LTC with bitcoin at $100,000, the ratio would have to rise to 0.001 BTC per LTC, roughly 51% above the starting ratio. These are two checkable conditions for a bullish argument. The $100,000 bitcoin price is an illustration.
The expected 2027 halving is a scheduled change in new issuance. At height 3,360,000 the block subsidy steps down from 6.25 to 3.125 LTC. The calendar day depends on block production. The two house models assign no automatic price jump to that block. To make an argued case for a sustained rerating, look for relative strength or persistent demand alongside lower issuance. A higher dollar price occurring while bitcoin rises can have a much simpler explanation. Litecoin’s halving interval and block subsidy calculation.
How to score this forecast later
Save the date, venue, event and original number together. For example, “Coinbase LTC-USD closes at or above $100 on 31 December 2027, probability 12.1%.” Once the UTC candle is complete, that event settles yes or no. For the path question, check every completed daily close after 21 November 2026 through the deadline, including weekends. The first close at or above $100 settles that event even if the price later falls. You can keep the original calls in a spreadsheet and score them yourself. Download the dated forecast scorecard.
This edition uses 3,612 consecutive daily closes. Our downloads include the original Coinbase responses, the independent Bitstamp starting-price check and the source hashes. The replay reads the frozen CSV with Python and NumPy and writes the year-end distribution, both path experiments and the historical forecast rows. The spot inputs, probabilities and scorecard in this article belong to this dated edition. A later edition can be compared with it directly. Full results and model assumptions, replay script, daily closes and original market data responses.