The working range in this outlook is $60–$120 for Litecoin's closing price on 31 December 2027. A move above $200 requires stronger joint price assumptions; sustained demand and relative strength would make it more convincing as a durable repricing. A return toward $400 belongs in the bullish stretch case. $1,000 is an extreme outcome with a much higher hurdle.
That is an editorial judgment made on 22 October 2026, not a statistically calibrated confidence interval. Prices below $30, a temporary speculative spike, or a market disruption that prevents an orderly exit all remain outside the comfortable middle of the forecast. The point of publishing the assumptions is to make the judgment possible to challenge.
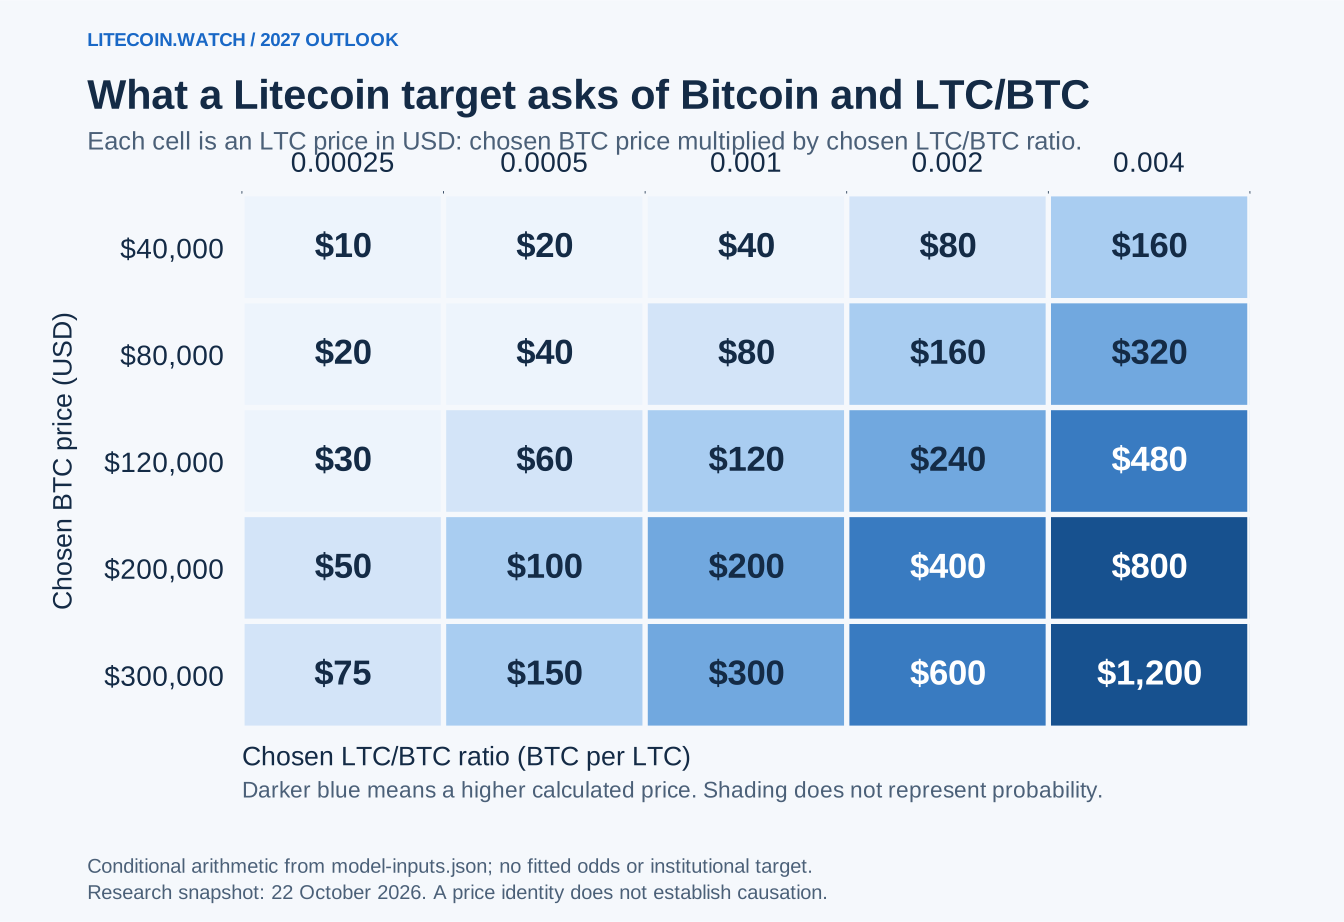
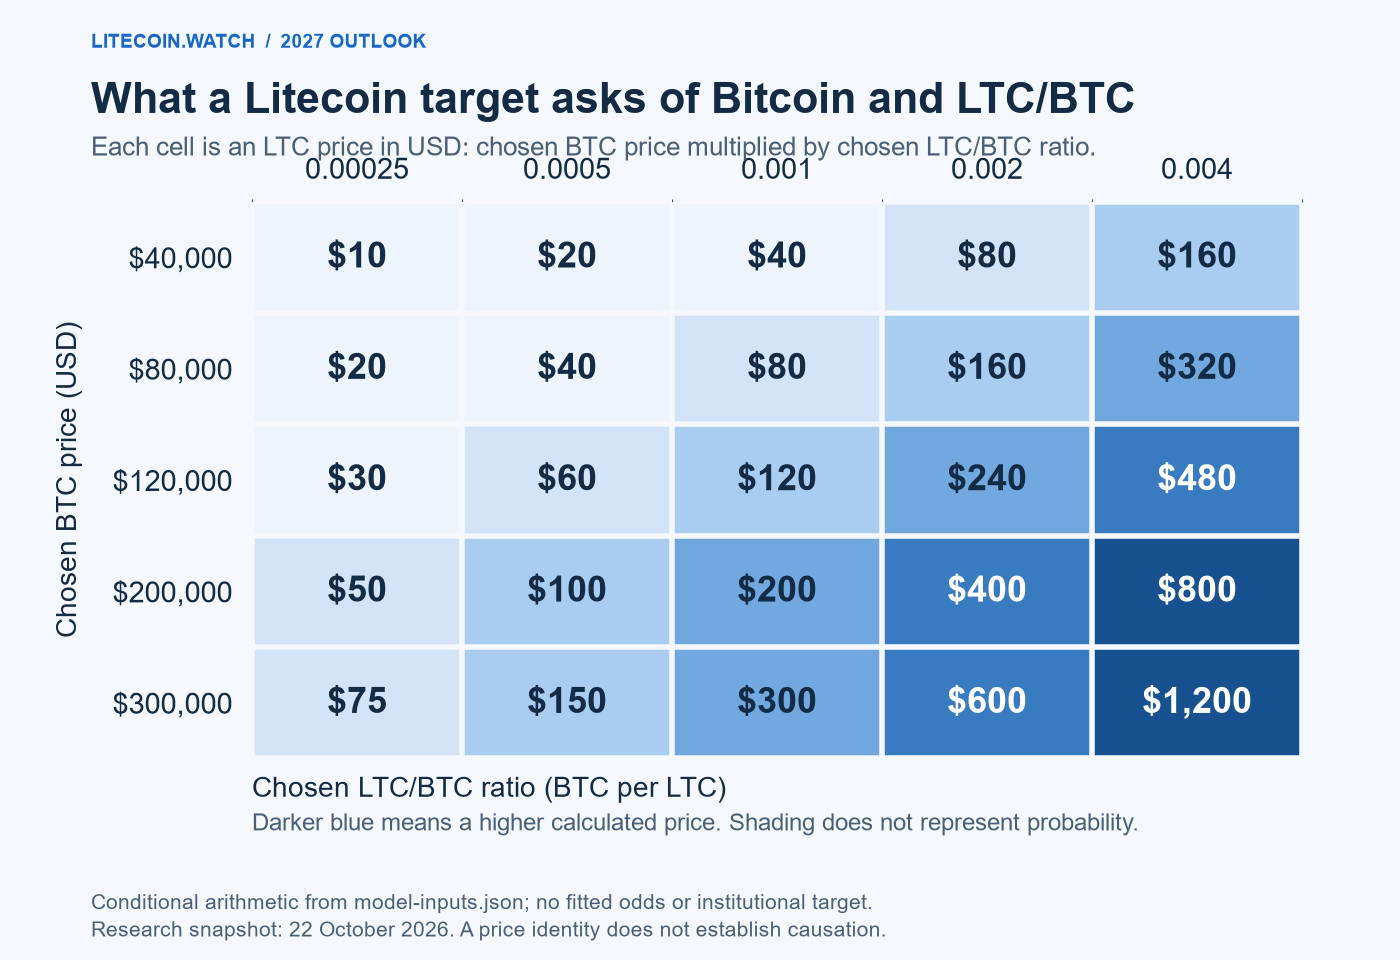
Bitcoin could rise sharply in 2027 and still leave Litecoin holders disappointed. At $120,000 BTC and an LTC/BTC ratio of 0.0005, Litecoin is worth $60. The halving could happen exactly as coded, wallets could keep working, and that outcome would remain possible.
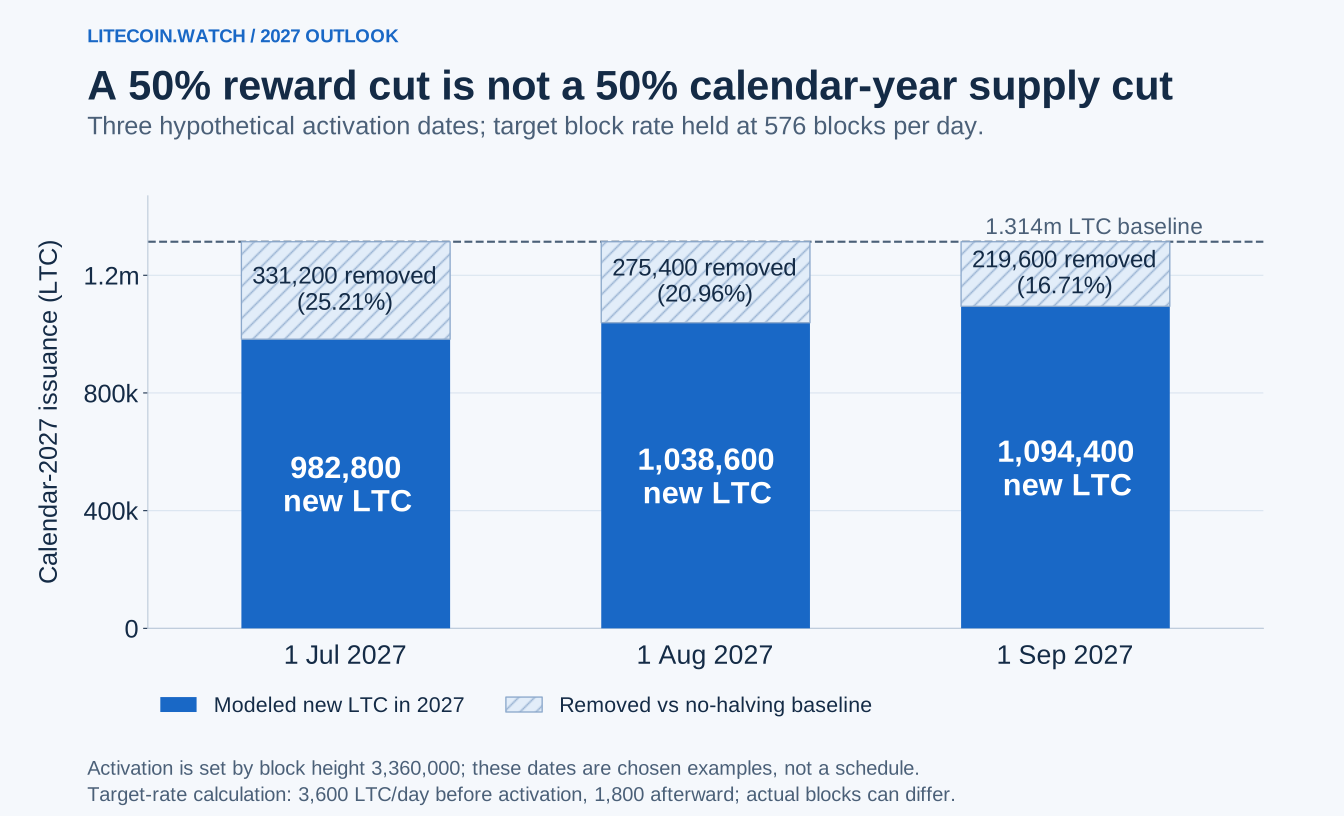
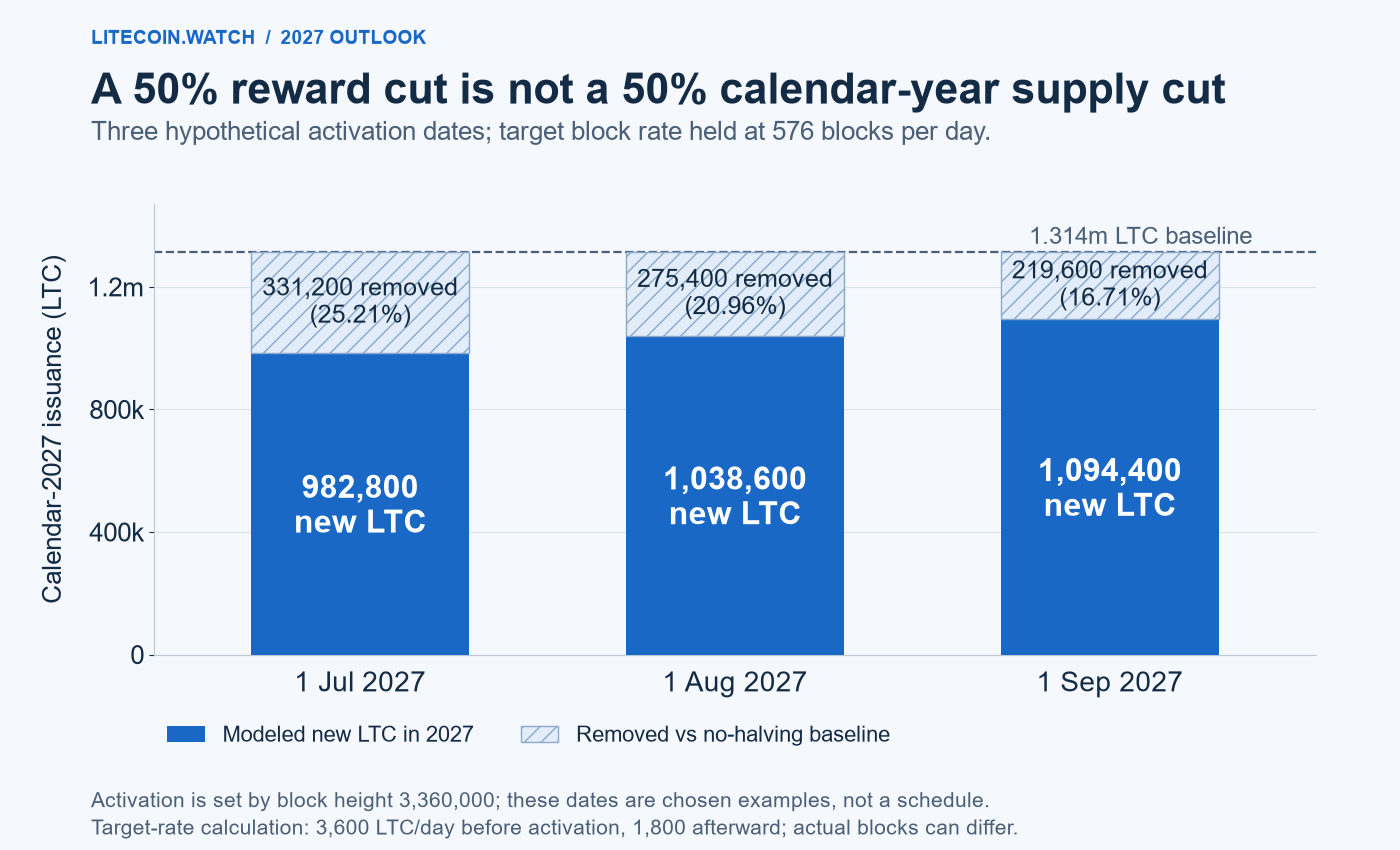
There is also a less obvious error in many 2027 forecasts: the halving cuts the issuance rate by 50% from activation onward. It does not cut the whole calendar year's new supply by 50%. Under an illustrative 1 August activation, target-rate issuance for 2027 falls by about 21%. That difference deserves more attention than another price target ending in two decimal places.
The starting point: a frozen close, not a moving ticker
This analysis uses the completed Coinbase Exchange daily candles through 21 October 2026. LTC closed at $61.521; BTC closed at $84,024.67. Dividing those closes gives 0.00073218 BTC per LTC. These are venue-specific historical observations, rather than a live executable quote.
We collected 2,120 daily candles for each asset, from 1 January 2021. The current partial day is excluded. Returned boundary candles were deduplicated only after checking that their values agreed. The Coinbase candle specification, captured observations and reproduction files are linked below.
At that starting close, $100 represents a gain of about 62.5%, $400 about 550.2%, and $1,000 about 1,525.5%, before costs. The distances change when the starting price changes. The assumptions in this edition do not silently move with the ticker at the top of the page.
The forecast's scored outcome is the Coinbase LTC-USD UTC daily candle close for 31 December 2027, available after that day ends. If a valid close is unavailable, the scored outcome remains unavailable; another venue must not be substituted silently. An annual intraday high, the highest daily close and an investor's realised sale price are different outcomes. None should be substituted afterward to make a missed call look successful.
Six ways 2027 could end
The following bands cover nonnegative year-end prices without overlap. They describe regimes; the BTC/ratio pairs are internally consistent examples, not exclusive routes to each outcome. No numerical probability has been assigned to a row.
| Scenario and closing band | One possible combination | The economic story |
|---|---|---|
| Severe damage: below $30 | $60,000 BTC × 0.00025 = $15 LTC | Persistent selling, a major access or security problem, or a weak market with further relative erosion. |
| Drift: $30 to below $90 | $120,000 × 0.0005 = $60 | Litecoin remains operational, but stronger Bitcoin prices are offset by weak LTC/BTC. |
| Recovery: $90 to below $200 | $150,000 × 0.001 = $150 | The broader market helps and Litecoin stops surrendering so much relative value. |
| Breakout: $200 to below $400 | $200,000 × 0.0015 = $300 | A supportive market meets sustained relative repricing and meaningful demand. |
| Euphoria: $400 to below $1,000 | $250,000 × 0.0025 = $625 | Exceptional speculative demand, expanding access and enough liquidity to support much higher prices. |
| Extreme tail: $1,000 or above | $250,000 × 0.004 = $1,000 | Several unusually favourable assumptions align, or a speculative dislocation persists into year-end. |
The $60–$120 working range sits across parts of the drift and recovery bands. It is a narrower editorial starting judgment within that broader map. It assumes that Litecoin retains functioning access and a usable network, while giving it no automatic claim on a new speculative boom.
The numerical starting box is $100,000–$150,000 BTC with an LTC/BTC ratio of 0.0006–0.0008, producing the $60–$120 endpoints. This already assumes a stronger Bitcoin than the frozen $84,024.67 close. The ratio box allows some further weakness at the bottom and only a modest improvement around the recent median at the top. It does not assume a return to the much higher relative valuations of earlier cycles. A weaker Bitcoin would require a different range.
A price below $30 would not require the chain to disappear. Markets can reprice a functioning asset severely. A quoted zero, meanwhile, can be a poor description of a failure in which liquidity or withdrawals vanish: the practical problem may be the inability to obtain an executable price at all.
What $100 actually asks of Bitcoin and the ratio
The identity is simple: LTC/USD = BTC/USD × LTC/BTC. It is an accounting relationship, not proof that Bitcoin causes or predicts Litecoin's return. Its value here is that it forces both assumptions into view at the same horizon.
A $100 LTC close needs a ratio of 0.001 if BTC closes at $100,000. With BTC at $200,000, the same target needs only 0.0005. In the second case Litecoin can rise in dollars while losing relative ground from the frozen starting ratio.
In the trailing 365 close-ratio observations, the range was approximately 0.000617–0.001064, with a median near 0.000760. That places 0.001 inside the observed recent range and 0.004 far outside it. Historical range membership is useful context; it supplies no probability that a future ratio will occur.
There is a second reason to avoid the “leveraged Bitcoin” shortcut. Using daily log returns ending on 21 October, the 365-return sample produced an LTC-on-BTC regression beta of about 0.93, while the 30-return sample produced 1.35. Correlations were approximately 0.72 and 0.46 respectively. The 90-return window sat between them, with correlation 0.62 and beta 0.95.
Those are descriptive estimates from one venue and selected windows, not statistically tested claims about a permanent population beta. They do show why multiplying a Bitcoin forecast by a constant historical leverage factor is unreliable. The price-research guide explains the distinction between association, causation and prediction.
The halving removes less 2027 supply than the headline suggests
Litecoin's mainnet parameters and subsidy function put the next reduction at height 3,360,000: 6.25 LTC becomes 3.125 LTC per block. With the 150-second target spacing, that corresponds to 3,600 versus 1,800 LTC per target day.
The often-quoted 657,000 LTC per year is the post-halving annual run rate. Calendar 2027 includes months at the old reward. To see the difference, choose three hypothetical activation dates and hold block production at the target rate.
| Hypothetical activation | New LTC during 2027 | Reduction versus no halving |
|---|---|---|
| 1 July: 181 old-rate days, 184 new-rate days | 982,800 LTC | 331,200 LTC, or 25.21% |
| 1 August: 212 old-rate days, 153 new-rate days | 1,038,600 LTC | 275,400 LTC, or 20.96% |
| 1 September: 243 old-rate days, 122 new-rate days | 1,094,400 LTC | 219,600 LTC, or 16.71% |
The comparison baseline is 365 × 3,600 = 1,314,000 LTC. These dates are illustrations, not three predicted activation dates or a confidence range. The event is selected by height, and actual block production will differ from a smooth daily model. The source-stamped countdown tracks the changing estimate.
Even the reduced issuance is not guaranteed selling. Some miners retain rewards, some sell inventory accumulated earlier, and merged-mining proceeds change the business calculation. The price effect depends on the sellers who actually disappear from the market and the buyers available on the other side.
Put the missing miner sales into dollars
After activation, the target-rate subsidy difference is 1,800 LTC per day. Suppose half that removed issuance would otherwise have reached the market and LTC trades at $120. The modelled reduction in gross subsidy sales is 1,800 × 50% × $120 = $108,000 per day.
At a zero sell-through assumption the direct reduction is zero. At full sell-through it is $216,000. The unknown is miner behaviour; the subsidy rule is specified. Changing the LTC price changes the dollar figure again.
This is a useful way to ask what the halving might remove from the sell side. It cannot tell us the price response. Gross reported trading volume is also the wrong denominator for claiming the effect must be tiny: turnover, executable depth and net selling pressure answer different questions.
Mining cost does not provide a contractual price floor. Miners can switch off, sell inventory or change their cost structure. DOGE revenue matters to a merged-mining operation, but Litecoin's halving does not halve that separate reward stream. The joint mining-revenue analysis is the appropriate starting point for that business question.
The institutional bull case has a measurable test
Lite Strategy's management makes a clear bullish argument in its 29 September 2026 results release: institutional capital has concentrated in Bitcoin, leaving Litecoin comparatively underrepresented, and broader access could expand demand. That is the opinion of a company with a financial interest in LTC. It contains no 2027 price target.
The strongest version of the thesis is that a relatively small change in willingness to hold LTC could matter in a market with limited available selling liquidity. The weak version simply counts a fund launch or corporate announcement and assumes appreciation follows.
There is already a US-listed Litecoin product. The first US-listed spot-Litecoin product is no longer a pending 2027 catalyst. Additional issuers or distribution could still change access. The original Nasdaq circular identified anticipated LTCC trading from 28 October 2025.
For scale, Canary's product page reports about $14.29 million in net assets as of 21 October 2026. Its separately dated 22 October LTCC holdings table lists 231,035.861322 LTC and 950,000 shares. These are issuer-reported fields with different dates, not an independent custody verification. The page mixes funds in its embedded tables, so the LTCC account filter matters.
What would change the 2027 argument is a sustained increase in coins held, reconciled with shares, expenses, creations and redemptions. AUM alone cannot do the job: rising LTC prices can lift AUM while the number of coins barely changes.
Choose a hypothetical net addition of 5,000 LTC per month. Annualised, that is 60,000 LTC: about 9.13% of the post-halving annual run rate, but only 5.78% of calendar issuance in the illustrative August case. At 50,000 a month, the corresponding figures become about 91.3% and 57.8%. These are demand-scale illustrations, not forecasts of LTCC inflows.
Even net fund coin additions are not automatically new aggregate buying. Depending on the mechanism, investors may deliver coins they already own or switch from direct holdings into a fund. The useful evidence is the change, its source and persistence. Comparing today's accumulated fund stock with tomorrow's daily issuance creates an impressive ratio without answering that question.
The bearish case is stronger than “Litecoin is dead”
Fidelity Digital Assets' report, published 21 August 2025, highlights competition from stablecoins and other networks and questions Litecoin's ability to compete with Bitcoin as a store of value. It also recognises possible niche uses. This is a dated investment thesis, not Fidelity's forecast of a particular LTC price in 2027.
The uncomfortable question is how much lasting demand a useful payment rail creates for holding its native asset. A coin bought shortly before a transfer and sold immediately afterward can support activity without building a large stock of long-term holders. Transaction growth alone does not answer the valuation question.
Stablecoin competition becomes more concrete in 2027. The OCC's final-rule bulletin of 21 October 2026 identifies 18 January 2027 as the effective date of the rule and GENIUS Act. That is a real calendar event. Its effect on issuer competition and payment routes remains conditional; it does not mechanically subtract a fixed number of dollars from LTC.
For a directly published numerical contrast, PrimeXBT's outlook dated 9 August 2026 lists a 2027 range of $40.43–$59.20 and an average of $49.32. Its full-year range and annual average are different outcome definitions from the December close used here. It is a broker's forecast, not institutional consensus. We could not reproduce a calibrated probability model for that table from the published inputs. Its two decimal places should not carry more authority than its method.
A 2026 quote above a forecast's 2027 maximum does not disprove a bearish forecast for the following year. Dates still matter: the broker page combines a dated forecast with a changing current-price section. Save the exact version and horizon before comparing predictions.
The downside extends beyond ordinary underperformance. Canary's March 2026 factsheet describes illiquidity, custody and loss risks, including the possibility of an investment becoming worthless. Those are product risk disclosures, not an assigned probability or a $0 price target. They belong in the extreme scenario even when a sponsor is selling exposure to the asset.
What would make $400 credible—and $1,000 more than a cell in a table
With BTC at $200,000, $400 LTC needs a ratio of 0.002. That is about 2.73 times the frozen starting ratio and roughly 1.88 times the highest close ratio in the trailing 365 observations. It asks for a substantial relative revaluation as well as a much stronger Bitcoin price.
The useful question is what would sustain it: persistent demand to hold LTC, broader effective access, better liquidity and confidence in the software and withdrawal routes. An isolated announcement is weaker evidence than a sequence of observable changes. A speculative squeeze could reach the same price briefly without establishing any durable improvement.
At $250,000 BTC, a $1,000 LTC target requires 0.004 BTC per LTC, about 5.46 times the frozen ratio. At $100,000 BTC it needs 0.01. At $500,000 BTC it needs 0.002. A four-figure target hides very different joint bets depending on which Bitcoin assumption sits underneath it.
For valuation scale, assume 79 million counted LTC and 20 million counted BTC at the same future date. These are deliberately rounded modelling inputs, not exact circulating-supply forecasts. $1,000 LTC then implies $79 billion of market value. Alongside $250,000 BTC, Litecoin represents about 1.58% of Bitcoin's assumed $5 trillion value.
That gives the relative ambition a readable scale. It does not prove the outcome likely. Nor does a $79 billion market cap mean $79 billion in fresh money must enter: marginal trades reprice the counted supply. Actual buying needed to move the price depends on the available book, hidden liquidity and holders' willingness to sell.
The mirror image matters too. A thin market can print a spectacular high that cannot accommodate large exits. A target reached on one venue for a few trades is a weaker investment outcome than sustained prices with usable depth. Our order-book study shows why quoted spread and full-order cost can differ sharply.
An annual high can make a bad forecast look good
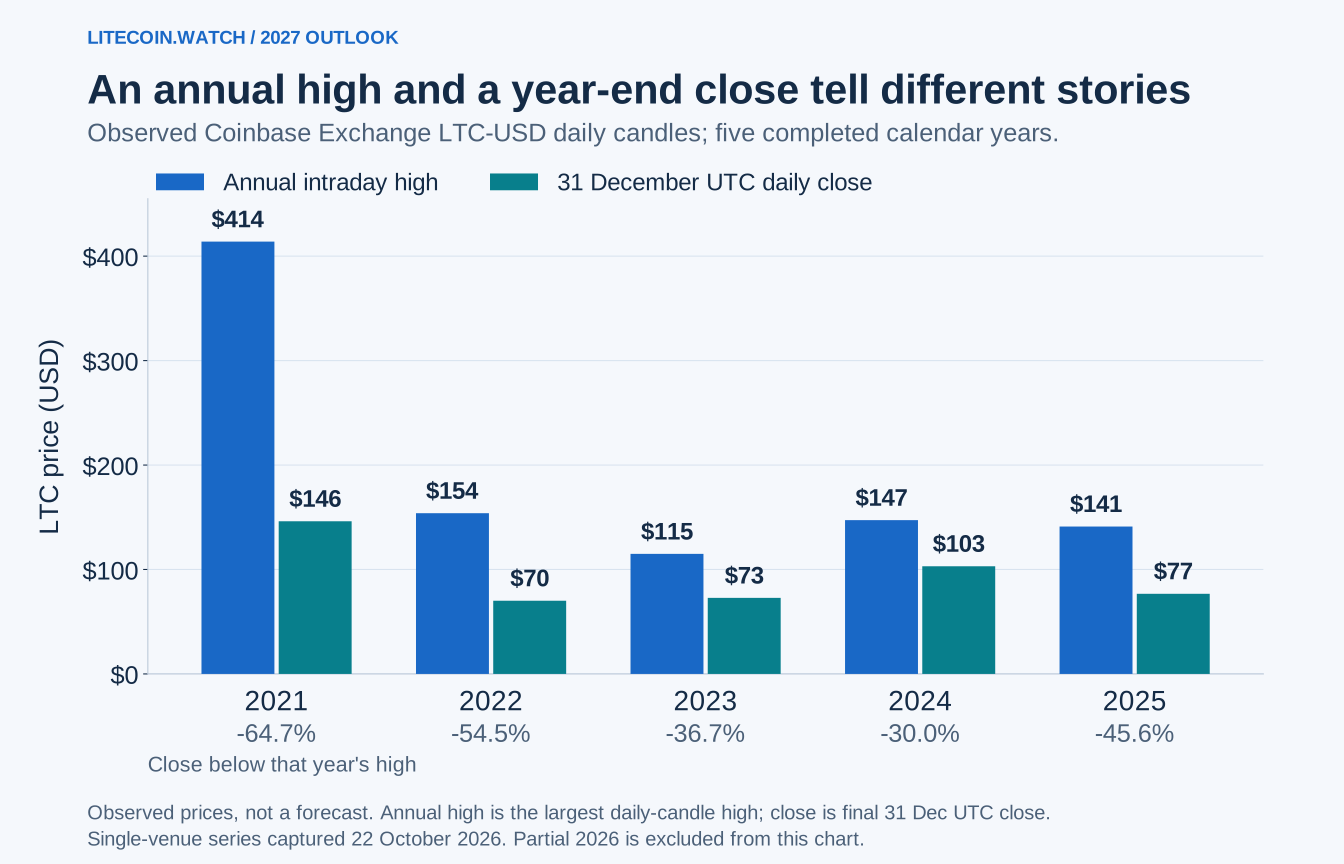
In the captured Coinbase series, LTC's 2021 intraday high was $413.91, while its 31 December close was $146.15. The closing price was 64.69% below the year's high. Neither figure is wrong. They answer different questions.
The same distinction appears in less spectacular years. In 2023, the venue's high was $114.98 and its year-end close $72.81. In 2025, they were $141.14 and $76.73. These are descriptive observations, not evidence that 2027 must repeat either path.
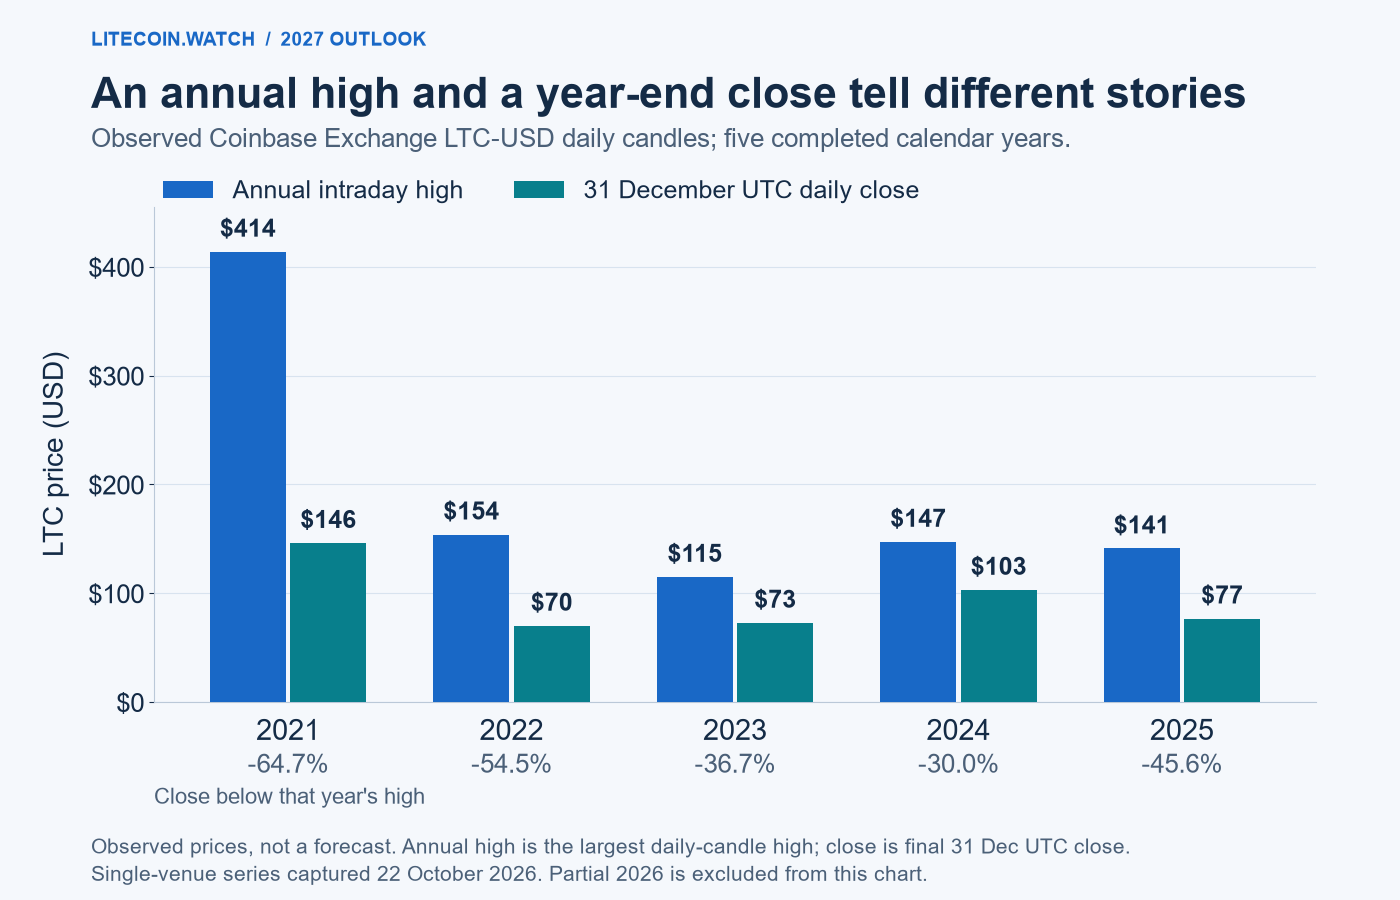
For 2027, I would judge a call for an annual $200 high much less demanding than a call for a $200 December close with sustained relative strength. A forecast writer should commit to one definition before the year begins, then report both the hit and the path honestly.
The same December result can hide a 72% drawdown
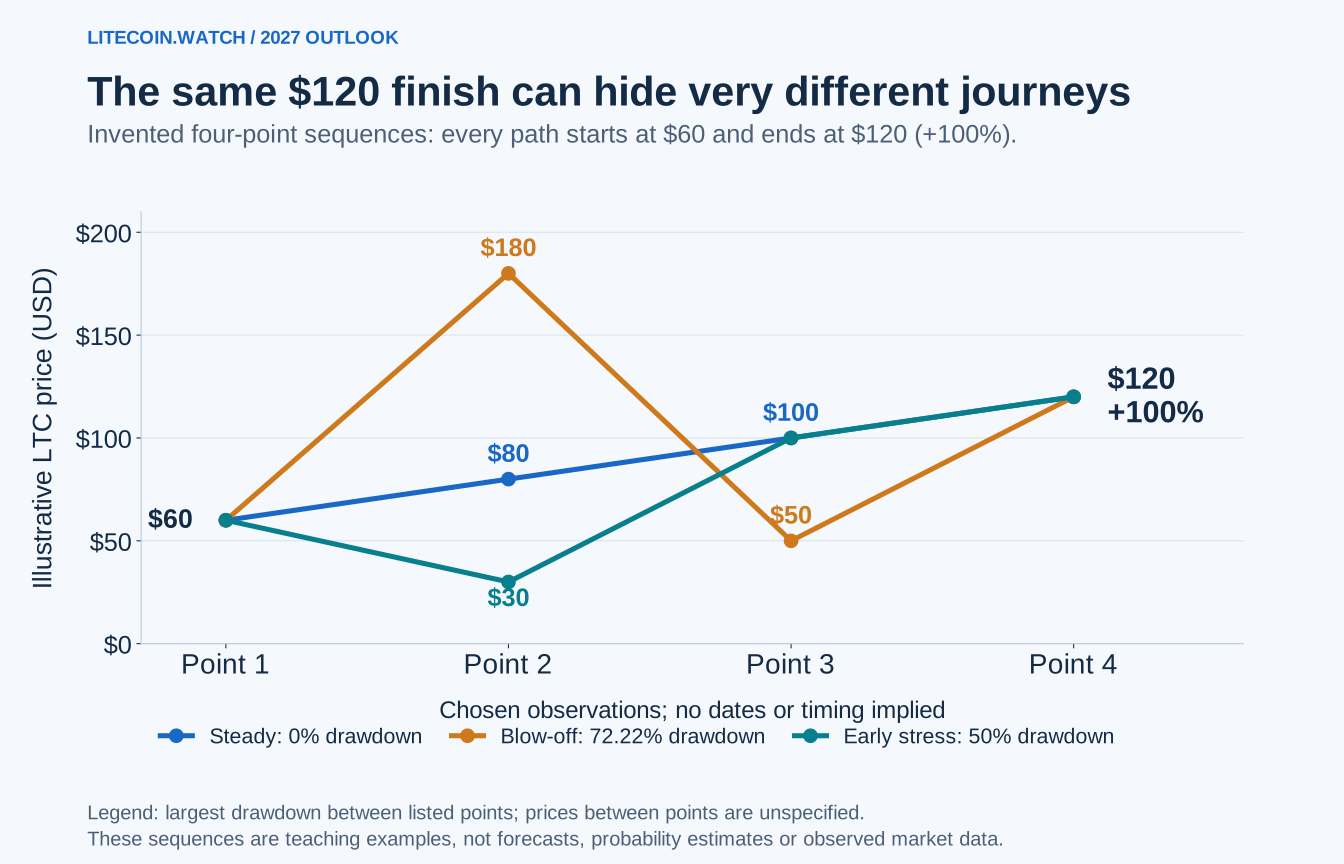
Consider three invented sequences of listed prices: $60 → $80 → $100 → $120; $60 → $180 → $50 → $120; and $60 → $30 → $100 → $120. All finish with a 100% gain from the same starting point.
The first has no drawdown between its listed observations. The second falls 72.22% from its listed peak; the third falls 50%. Prices between the observations could be worse. The prices are chosen observations, rather than proposed quarterly targets.
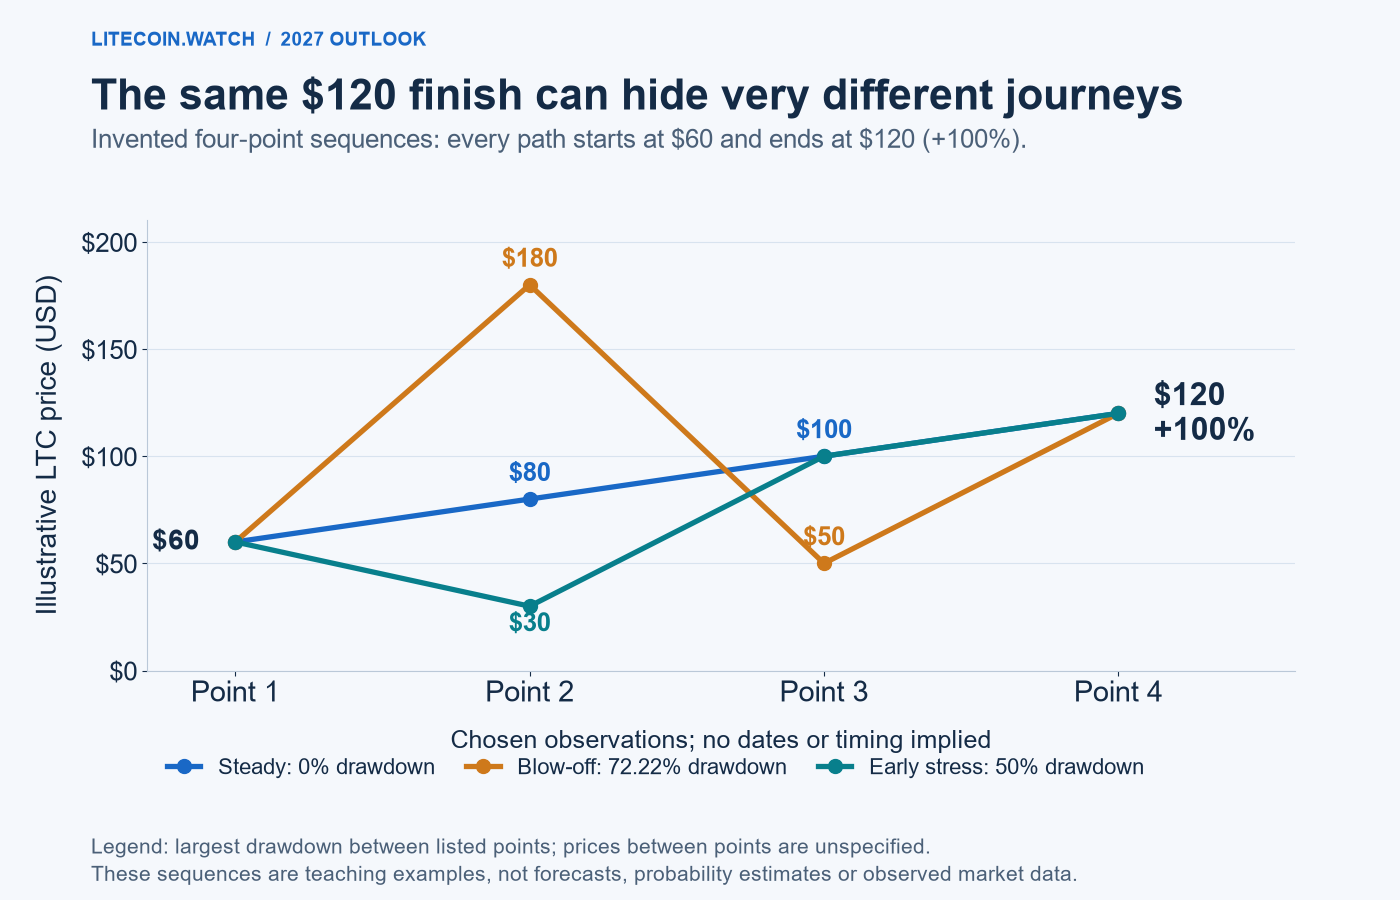
A $120 December close tells you little about what it took to remain invested until December. Borrowing, a fixed cash need or a forced sale can turn the path into the main event. A year-end target is therefore incomplete without a discussion of intervening losses and access.
The captured historical series supplies a reason to take that seriously. Its maximum close-to-close drawdown was about 89.48%: a $388.30 peak close in May 2021 followed by a $40.85 trough close in June 2026. That is the largest drawdown experienced inside the sample, not the drawdown remaining at the October endpoint.
Why an average target can tell the wrong story
Suppose a purely invented forecast assigns 55% to $80, 35% to $180 and 10% to $800. Its mean is $187, while its median is $80. The small high-price tail contributes $80, or roughly 42.8% of the mean.
Those weights are a teaching example, not this article's probabilities. They show why an “average 2027 target” may describe neither the most common outcome nor a sensible central planning case. Averaging forecasts with incompatible horizons makes the interpretation weaker still.
The BTC/ratio matrix also should not be mistaken for a probability engine. The two axes can be dependent. In logarithms, Litecoin-price variance contains the variance of Bitcoin, the variance of the ratio and twice their covariance. Independently sampling the two and counting how often LTC reaches $400 manufactures odds unless that independence assumption is justified.
This edition therefore publishes conditional cases without percentages attached. A future probability model would need stated estimation windows, a dependence model, regime assumptions and evaluation on observations not used to fit it. Running more simulations cannot repair missing assumptions.
The 2027 calendar worth watching
January: the stated 18 January GENIUS implementation date gives stablecoin competition a concrete policy milestone. Watch actual issuer and payment-service changes, rather than assuming regulation instantly changes consumer behaviour.
Before the halving: track remaining blocks, the evolving date estimate and miner economics. A pre-event rally can pull expected gains forward. Once the event arrives, the market compares reality with what was already priced in; a known supply rule is not automatically a fresh surprise.
After the halving: distinguish the new daily issuance rate from calendar-year totals. Compare fund coin additions, miner selling assumptions and liquidity over the same interval. A single strong week is a different observation from persistent demand across several months.
Throughout the year: take operational evidence seriously. The developer postmortem published in April 2026 documents real MWEB incidents. The September 2026 Core release notes describe subsequent improvements. An old network still needs maintained software, reliable withdrawals and credible incident handling.
LitVM and other applications can become additional sources of demand, but a timetable or testnet counter is insufficient. Look for a production route, identifiable assets, functioning exits and use that requires holding or consuming LTC. The LitVM review records the current documentation gaps; this forecast assumes no guaranteed 2027 launch or quantified application-driven buying.
What would change the $60–$120 working range
I would become more willing to use a higher range if relative strength persisted while the broader price backdrop remained supportive, and if that repricing came with improving access, reconciled holder demand and usable liquidity. A price that rises solely because Bitcoin rises is a weaker case for a durable LTC-specific revaluation.
For a concrete review rule, one could require four consecutive Sunday UTC close ratios above 0.001 before treating a recovery in relative strength as persistent enough to revisit. At $120,000 BTC, that ratio corresponds to $120 LTC. The four-week requirement is a chosen editorial filter, not a backtested trading signal.
The range would need a downward review if the ratio spent a comparable period below 0.0005, if Bitcoin's assumed price backdrop weakened, or if a material security or access problem changed the ability to hold and trade LTC. At $80,000 BTC and 0.0005, the arithmetic is $40. Repeating the old target while changing both underlying assumptions would make the forecast less useful.
| Observation | What to preserve | Question for the forecast |
|---|---|---|
| LTC/USD and LTC/BTC | Venue, UTC close and unchanged target definition | Has the relative hurdle actually narrowed? |
| Fund holdings and shares | Compatible dates, coin changes, redemptions and expenses | Is the demand thesis stronger than an AUM headline? |
| Liquidity | Same venue and order sizes, spread and full-order cost | Can the apparent price support meaningful transactions? |
| Software and access | Official advisories, delivered fixes and actual route changes | Did the operational assumptions survive? |
| Halving and miner economics | Height, time basis, reward mix and explicit selling assumptions | What changed in available supply, rather than in a slogan? |
The blank review ledger leaves space for the old judgment, new observation and reason for a revision. Keep the previous version. An analyst who repeatedly moves the horizon, switches between highs and closes, or quietly replaces the original ratio assumption is changing the forecast rather than evaluating it.
The forecast I would carry into 2027
The $60–$120 year-end range is the starting position in this edition. $100 is reachable under several combinations shown in the grid, although “reachable” does not establish the chance of finishing there. A sustained price above $200 asks for stronger joint assumptions. $400 needs a clear relative repricing or an unusually high Bitcoin price. $1,000 requires an exceptional combination and should be treated accordingly.
The most informative development in 2027 may be the one that changes the ratio and the willingness to hold LTC, rather than the most widely advertised event. The halving changes an issuance schedule. Turning that change into a lasting valuation requires buyers, available liquidity and confidence that survives setbacks.
All price ranges here are nominal USD values for LTC itself. A fund share, treasury stock, leveraged position or return in another spending currency adds further variables. None of these ranges is a guaranteed exit price or a recommendation sized to an individual reader's finances.
Data, calculations and what was actually checked
The research was frozen on 22 October 2026. It contains 2,120 paired daily observations per asset, 16 raw API responses, three log-return regression windows and explicit model inputs. No gaps were found in the selected UTC dates; overlapping boundary candles agreed. A second calculation checked the raw-file hashes, reconstructed values and reported statistics. That is a consistency check of the captured source, not a separately acquired price feed or an independent investment audit.
The annual high comparison uses five completed calendar years. The ratio range uses 365 closes from 22 October 2025; the 365-return regression needs 366 closes beginning a day earlier. Correlation and beta describe those windows; they do not establish causation, statistical significance or 2027 forecasting accuracy.
Download the daily data, raw-response archive, capture manifest, chosen assumptions, complete results and Python reproduction script. Save the script with a .py extension beside the data, manifest, inputs and ZIP, then run it with Python 3. It reads local files and prints JSON; it has no network, wallet or trading operations and writes no files.
The source record preserves the selected issuer fields and opinion dates, including the distinction between 21 October AUM and 22 October holdings. Method notes explain the limits; checksums identify the files. This article introduces a dated scenario audit, calendar-year issuance model and captured price analysis; it does not claim access to secret order flow or undisclosed institutional targets.
Frequently asked questions
What is the Litecoin price prediction for 2027 in this analysis?
The working editorial range is $60–$120 for the 31 December 2027 Coinbase LTC-USD UTC daily close. It is a conditional judgment, not a calibrated confidence interval or a guaranteed range.
Could Litecoin reach $400 or $1,000 in 2027?
Those outcomes are mathematically possible but require much stronger assumptions. At $200,000 BTC, $400 LTC needs a 0.002 ratio. At $250,000 BTC, $1,000 LTC needs 0.004. A brief annual high and a year-end close are different forecasts.
Will the 2027 halving cut that year's new supply by 50%?
It halves the reward rate from activation onward. Under a chosen 1 August date and target-rate blocks, calendar-2027 issuance falls about 20.96% against a no-halving baseline. The actual event is selected by block height.
Are the scenario probabilities estimated?
No probabilities are assigned to the six scenarios. The separate weighted-price example is deliberately invented to explain why a mean target can differ sharply from a median.
Do Fidelity or Lite Strategy endorse these price targets?
No. Their dated public views are discussed with attribution, but neither supplies the $60–$120 range or the scenario targets used here. Those are this article's conditional editorial assumptions.
How can readers check or update the analysis?
The frozen data, raw responses, inputs, results and offline Python script are downloadable. Use the blank review ledger to record new observations without silently changing the original horizon, benchmark or assumptions.