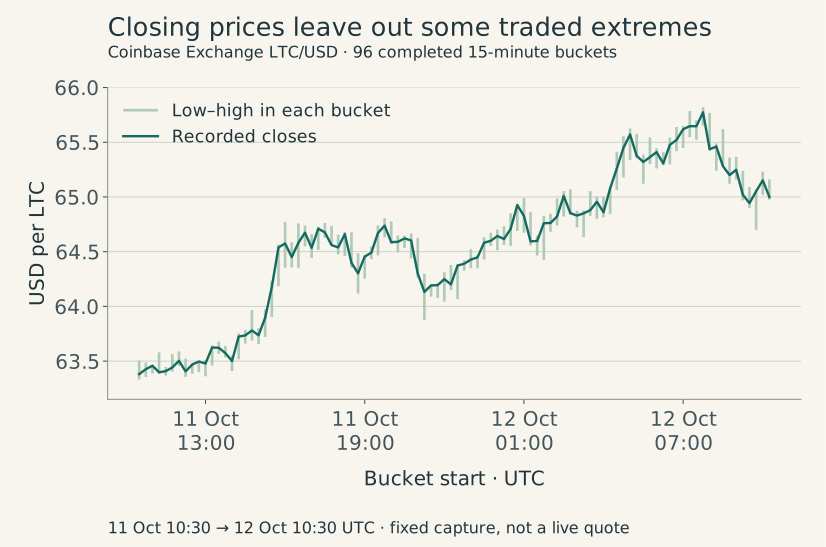
In our frozen Litecoin chart sample, the price rose 2.55%. Its highest point is $65.773. You might reasonably read that as the day’s highest traded price and assume the line shows everything that happened between the first and last point. Both conclusions would be wrong for the snapshot examined here.
Our 24-hour chart plots completed 15-minute Coinbase Exchange LTC/USD closes. A close is one recorded trade price from each interval, not the whole interval. The distinction matters when you compare returns, inspect a sharp move or ask whether a quoted price was available to you.
We froze one 24-hour bucket window and calculated its closes, highs, lows and close-based drawdown. You can download the raw response and reproduce the arithmetic. Two separately labelled fictional price paths show what even full open-high-low-close data cannot recover.
Read the label before the line
Start with three labels: the asset pair, the venue and the kind of observation. LTC/USD is a price in US dollars. It is not your return in euros, your exchange’s current buying offer or an average of every Litecoin market.
The plotted series on Litecoin.watch comes from Coinbase Exchange. On the current page, Line and Area change its appearance while using the same close values. Filling the area beneath a line does not add trading volume, and a line joining two closes does not establish a smooth path between them.
The page also shows a current reference quote and separate 24-hour aggregate statistics. Those observations have their own sources and timestamps. They do not become the plotted series just because they appear beside it. Changing the chart range does not redefine a separate rolling 24-hour statistic.
Read the price axis too. A narrow vertical range can make a small dollar change occupy much of the screen. Use the actual values and percentage calculation rather than judging the size of a move from its visual steepness.
What one 15-minute point contains
Coinbase’s candle definitions describe time, low, high, open, close and volume fields. The time identifies the bucket’s start. Our plotted point selects the close from that completed bucket.
| Field | Meaning | What it does not establish |
|---|---|---|
| Start time | The interval’s UTC starting boundary. | The exact time of its last trade. |
| Open | The first traded price in the interval. | A price you could necessarily execute. |
| High / low | The price extremes reported for the interval. | Which extreme occurred first. |
| Close | The last traded price in the interval. | Every price traded during it. |
| Volume | The provider’s reported trading-activity field. | Your executable order size or the whole market’s activity. |
A point labelled 10:30 UTC belongs to the 10:30–10:45 bucket. Its close was that bucket’s last trade; the response does not tell us that trade occurred exactly at 10:45. The interval end is a useful boundary, not an additional observed tick timestamp.
An OHLC candlestick can display its open, high, low and close together. Our Line and Area chart displays closes instead. Its “Highest recorded close” label is therefore deliberate. Adding a candle-shaped graphic without obtaining the other prices would not supply the missing evidence.
Check a frozen window against its own source
The sample covers buckets starting from 11 October 2026, 10:30 UTC, through the interval ending 12 October 2026, 10:30 UTC. We requested 900-second LTC-USD candles from Coinbase’s public API and retained the response retrieved at 10:31:53.906859 UTC on 12 October.
The raw response contained 97 rows. One started at the excluded end boundary, 12 October 10:30, so it did not belong to our completed window. Filtering left all 96 expected buckets, with no missing intervals, invalid records or duplicate starts. This coverage describes that venue and frozen response; it is not an independent audit of every underlying trade.
| Observation | USD price | Bucket start · UTC |
|---|---|---|
| Highest reported bucket high | 65.82 | 12 Oct 2026 · 07:45 |
| Highest recorded close | 65.773 | 12 Oct 2026 · 07:45 |
| Lowest reported bucket low | 63.331 | 11 Oct 2026 · 10:30 |
| Lowest recorded close | 63.381 | 11 Oct 2026 · 10:30 |
Here the highest high exceeds the highest close by $0.047. The lowest close exceeds the lowest low by $0.050. The gap happens to be small in this sample. It still shows that a close-only chart omits trades inside its intervals. Another sample could have a different gap; this one does not establish its typical size.
These are provider-reported prices, not claims about all venues. We preserved the numerical precision supplied by the API rather than rounding every price to two decimals before calculating. Download the unchanged raw response, filtered candle CSV and source and retrieval record.

The return starts at the first recorded close
The first close in the sample is $63.381, from the bucket beginning 11 October at 10:30 UTC. The last is $65, from the bucket beginning 12 October at 10:15 UTC. Their comparison is:
(65 ÷ 63.381 − 1) × 100 = +2.55439327%, rounded to eight decimal places. At four decimals, that is +2.5544%.
The bucket window lasts 24 hours, but the nominal ends of those first and last buckets are only 23 hours 45 minutes apart: 11 October 10:45 to 12 October 10:30. Their actual last-trade timestamps are unavailable in this response. This is a change between the first and last recorded closes, not a measured return between trades at two exact 24-hour endpoints.
A return from the first bucket’s open would answer a different question. A rolling market headline might use another start point again. Record the starting and ending observations before comparing two percentages; identical “24h” labels are not enough.
This price comparison also contains no trading fee, spread, withdrawal charge or currency conversion. If you bought and sold, use the actual execution prices and costs. The Litecoin calculator can model a conversion with explicit cost assumptions; it does not convert a historical chart return into your personal profit.
Drawdown depends on what you recorded
Maximum drawdown asks how far the series fell from an earlier peak to a later point, relative to that peak. A gain across the whole selection does not prevent a decline within it.
For this sample, the largest decline between recorded closes runs from $65.773 in the 12 October 07:45 bucket to $64.944 in the 09:30 bucket:
(65.773 − 64.944) ÷ 65.773 × 100 = 1.26039560%, rounded to eight decimals. The chart’s close-based measure is about 1.2604%.
| Measure | Starting close | Ending close | Result |
|---|---|---|---|
| First-to-last change | 63.381 | 65 | +2.55439327% |
| Largest earlier-close decline | 65.773 | 64.944 | 1.26039560% |
The calculation follows closes in chronological order. It does not replace them with the highest and lowest prices anywhere in the sample: a low occurring before a high is not a decline from that later high.
Nor is this a measurement of the worst movement experienced by someone watching every trade. A sharp fall and recovery within one bucket can be largely absent from its close. To measure an ordered trade path, you need ordered trade observations; open, high, low and close alone cannot always supply them.
The same candle can hide a different order
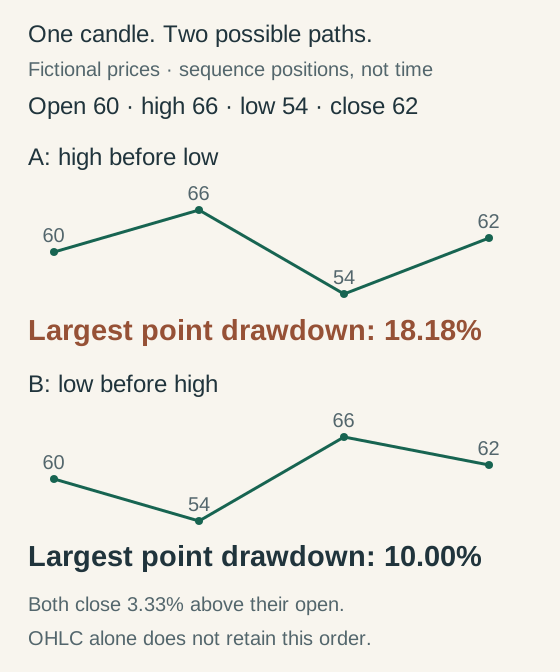
Consider two fictional paths, each containing four ordered prices. They are teaching points, not observed Litecoin ticks, and have no trade timestamps, volume or execution assumptions.
| Path | Ordered prices | First-to-last change | Largest ordered-point decline |
|---|---|---|---|
| A · High before low | 60 → 66 → 54 → 62 | +3.33333333% | 18.18181818% |
| B · Low before high | 60 → 54 → 66 → 62 | +3.33333333% | 10.00000000% |
Both have open 60, high 66, low 54 and close 62. Both gain 2 from their opening point: 2 ÷ 60 × 100 = 3.33333333%, rounded. The final candle would look the same.
In path A, the earlier peak is 66 before the decline to 54, so the drop is 12 ÷ 66 × 100 = 18.18181818%. In path B, the first decline is 60 to 54, or 10%. Its later decline from 66 to 62 is about 6.06%, so the worst recorded decline remains 10%.
Calculating (66 − 54) ÷ 66 for both paths would invent an order in path B. A candlestick records extremes but does not prove the high came before the low. You cannot reconstruct a stop-trigger sequence, trade timing or strategy performance from these four fields alone.
The example makes no forecast and is not a backtest. No hypothetical order was placed, and no bid, ask, fee or fill model is included. Download the labelled fictional paths to check the calculation separately from the observed sample.

A blank gap is not a zero price
The frozen sample has complete bucket coverage, but that is not guaranteed for another date or request. Coinbase warns that its historical endpoint can omit intervals without trades. A missing observation therefore needs its coverage context; you should not silently replace it with zero or assume the price stayed unchanged.
The Litecoin.watch chart keeps missing observations as gaps. Its coverage labels distinguish the retained archive from missing intervals within that archive and recently expected observations that have not been recorded. “Recorded history” means our available archive, not every Litecoin trading day since launch.
If adjacent available closes are farther apart than the selected interval, their percentage change spans that longer gap. It is not automatically a one-candle move. A straight connection or a carried-forward value would hide that distinction. Save coverage alongside the values you export.
Keep retrieval time separate too. It tells you when a dataset was fetched, not when each trade occurred. A refresh failure may leave a labelled cached chart; it does not turn old closes into current executable prices.
Use the chart for a specific question
To inspect a point, move or tap across the chart. With the plot focused, the arrow keys move through recorded closes; Home and End select its endpoints. Check the UTC time, price, range and coverage before copying a number. The table and CSV expose the same plotted observations.
If your question is “What could I buy now?”, historical closes cannot answer it. Coinbase publishes trade records separately from its order book. A past trade is not a promise of present availability. Use the provider’s current quote, order size and full charges; our LTC/EUR liquidity tool explains recorded depth on its own specified markets.
Print the blank chart-reading checklist for the pair, source, interval, timestamp meaning, endpoint observations and costs you need. The frozen results, offline reproducer and independent rational-arithmetic checker let you inspect our calculations. Verify files against the checksums.
Source review and retrieval: 12 October 2026. The method record and primary sources separate the observed API response from constructed teaching examples. The scripts use decimal parsing and exact fractions without live API calls. We executed no trades, audited no exchange matching engine and tested no investment strategy. Research and drafting used AI assistance; no independent external review is claimed. Report corrections through our corrections page.
The artwork record identifies the generated conceptual hero and original explanatory diagram.