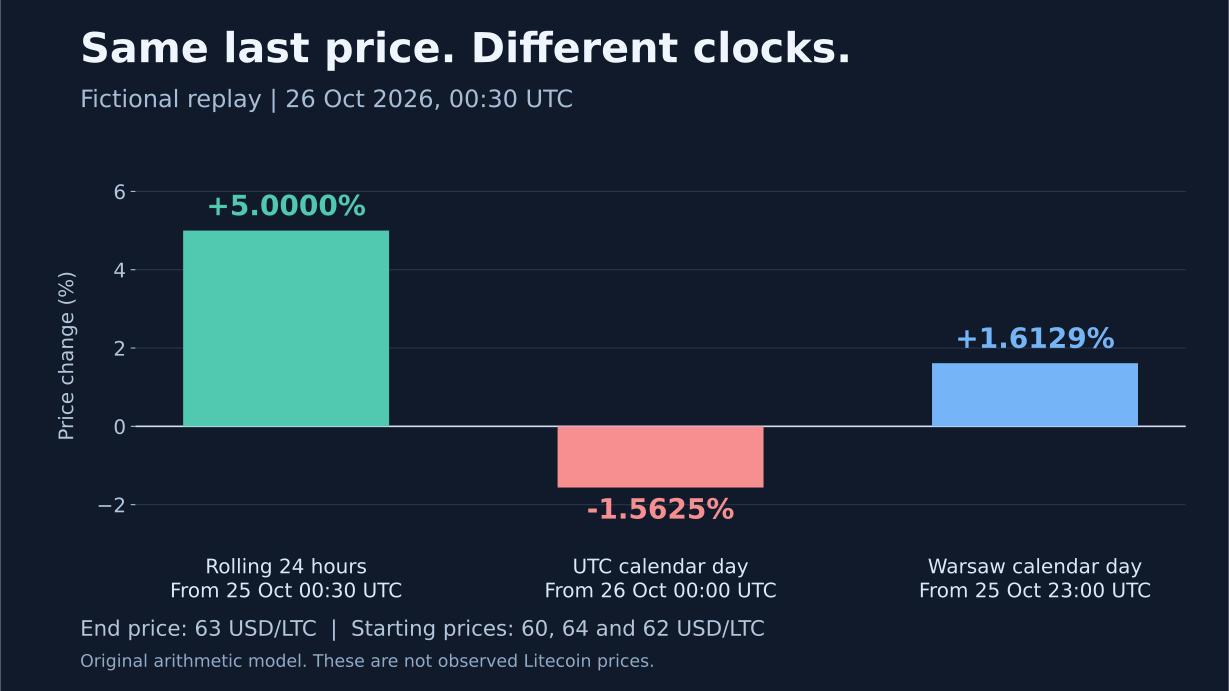
Litecoin can be up 5% over one window and down 1.56% over another, even when both displays use the same latest dollar price. Before deciding that a tracker is wrong, ask a smaller question: which earlier price sits underneath that percentage?
We built an eight-point fictional sequence to make the difference visible. At one chosen instant, a $63 LTC price produces three different answers for a rolling 24 hours, the UTC calendar day and the Warsaw calendar day. An hour later, its rolling badge turns negative while the latest value remains $63. Only its older comparison point has changed. Every price below is constructed for this demonstration, not an observed Litecoin quote or a prediction for the dates shown.
A percentage needs a starting observation
The familiar calculation is (ending price / starting price − 1) × 100. Knowing the ending price is not enough. A badge also depends on its starting observation, quote currency and price series.
“24h,” “today” and “1D” are not interchangeable definitions. A rolling window advances with the clock. A calendar-day measure resets at a chosen midnight. A chart button might select a bucket range without changing a neighbouring statistic. Record the definition before comparing the numbers.
This is a reference-price change, not a result from buying and selling. It contains no spread, fees, cash contributions or withdrawals. Those belong in the separate guide to your actual Litecoin return.
One $63 endpoint, three answers
Set the fictional clock to 26 October 2026, 00:30 UTC. In Europe/Warsaw, that is 01:30 with a +01:00 offset. The latest synthetic LTC/USD observation is 63 dollars per LTC.
Our exact starting observations are $60 at the rolling boundary, $64 at UTC midnight and $62 at Warsaw midnight. They belong to the same deliberately sparse sequence. We do not infer any prices between them.
| Definition | Starting instant · UTC | Elapsed time | Starting USD/LTC | Change to 63 USD/LTC |
|---|---|---|---|---|
| Rolling 24 hours | 25 Oct · 00:30 | 24 hours | 60 | +5.0000% |
| UTC calendar day so far | 26 Oct · 00:00 | 30 minutes | 64 | −1.5625% |
| Warsaw calendar day so far | 25 Oct · 23:00 | 90 minutes | 62 | +1.6129% |
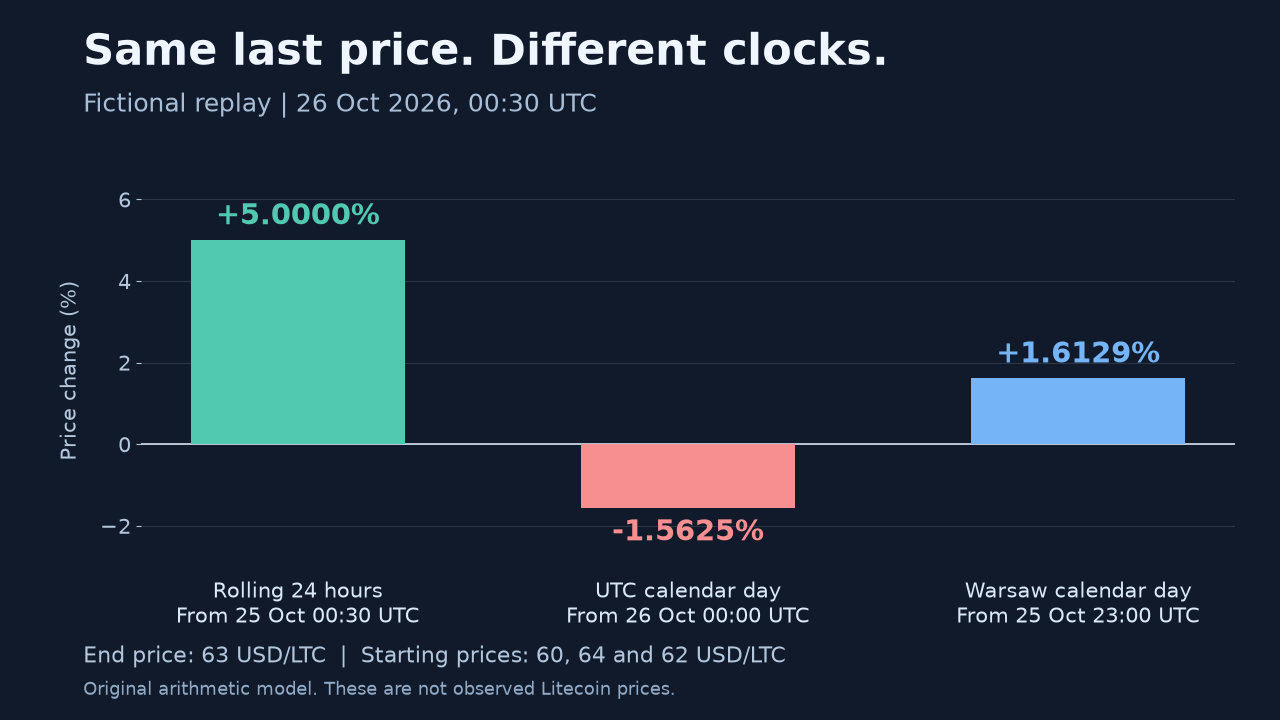
The arithmetic is 63 / 60 − 1 = 0.05, 63 / 64 − 1 = −0.015625 and 63 / 62 − 1 ≈ 0.0161290323. Multiply each by 100 for a percentage. Changing the denominator changes the question, even though the numerator stays the same.
“Today” has covered only part of a day here. It does not mean a completed 24-hour interval, and a smaller calendar-day gain does not establish that a rolling tracker overstated anything.
A green badge can turn red without a new latest price
Advance the fictional clock one hour, to 26 October at 01:30 UTC. Keep the latest value at $63. The rolling starting boundary has moved too: it now selects our $65 observation from 25 October at 01:30 UTC.
| End · UTC, 26 Oct | 24-hour starting price | Latest price | Rolling change |
|---|---|---|---|
| 00:30 | $60 | $63 | +5.0000% |
| 01:30 | $65 | $63 | −3.0769% |
The second result is (63 / 65 − 1) × 100. Its colour changes because the older comparison value changed, not because our latest value fell during that hour.
A rolling percentage is therefore not the price movement since your last refresh. This construction proves the arithmetic possibility; it says nothing about how often it happens in Litecoin markets, whether trading stopped, or what any particular app displayed.
The repeated hour needs its offset
The dates are useful because Warsaw moves from summer to standard time on 25 October 2026. In our sequence, 2026-10-25T00:30:00Z converts to 02:30:00+02:00. An hour later, 2026-10-25T01:30:00Z converts to 02:30:00+01:00. The same local clock label identifies two different instants.
Save the date and offset, or an unambiguous UTC timestamp, rather than a bare “02:30.” Python's zoneinfo documentation describes this repeated-hour distinction through its fold attribute. Our script exports both offsets and fold values. The pinned timezone source supplies the Warsaw rules used for the cross-check.
There is a second trap. Starting at 26 October, 01:30 Warsaw time, “yesterday at 01:30” is 25 hours earlier in elapsed UTC time. Subtracting one local calendar day does not produce the same starting instant as subtracting 86,400 seconds.
The completed Warsaw date 25 October also lasts 25 hours. A calendar-day calculation can be valid across that interval; it needs an honest calendar-day label. Our replay converts both endpoints to UTC before measuring elapsed time.
Read the API field, not just the endpoint name
Kraken's ticker documentation defines today's statistics from midnight UTC. It identifies o as today's opening price and c as the last closed trade array. Calculating c[0] / o − 1 compares the reported last price with that UTC-day opening statistic. It does not create a rolling 24-hour opening observation.
Some arrays in the same response contain both today and 24-hour fields. That does not make every second array element a starting price: p[1] is a 24-hour volume-weighted average price. Dividing by a VWAP measures a difference from an average, not from the window's opening observation.
Coinbase Exchange's product stats documentation describes 24-hour and 30-day statistics and exposes open and last. Do not transplant Kraken's calendar-day meaning onto another provider just because both use an “open” label.
Neither response turns a local receipt timestamp into the exact event time of each quoted trade. An opening statistic is also not proof that a trade happened at the precise boundary used by our synthetic model. Check the provider's definition and preserve whatever timestamps it actually supplies.
Dollars and euros need the same endpoints
Changing the quote currency can change the badge again. Suppose, over the same fictional 24 hours, LTC/USD rises from 60 to 63 and EUR/USD rises from 1.10 to 1.155. EUR/USD here means dollars per euro.
The derived LTC/EUR reference is LTC/USD divided by EUR/USD at each endpoint. Its return is [(63 / 60) / (1.155 / 1.10) − 1] × 100 = 0%. Litecoin's 5% dollar rise is exactly matched by the euro's 5% dollar rise in this example.
This is a frictionless currency identity, not a captured LTC/EUR venue quote. Converting both historical LTC/USD endpoints using only today's FX rate would erase the currency movement we are trying to measure. The calculator can check a conversion, but a current rate is not evidence of an old rate.
A useful way to compare two displays
- Write down the pair and units. LTC/USD, LTC/EUR and LTC/BTC ask different questions.
- Name the series. A venue's last trade, a midpoint and an index need not match.
- Save the displayed time and freshness. Request receipt, a candle boundary and a trade event are different timestamps.
- Find the denominator rule. Rolling window, UTC midnight and local midnight should be named explicitly.
- Check the selected observations. If an exact boundary observation is unavailable, record the substitution or approximation instead of pretending it was exact.
- Recalculate before judging the discrepancy. Only after the definitions match is the remaining difference a useful data-quality question.
For candles, the distinction between a bucket boundary and its final trade deserves particular care. Our chart-reading experiment examines that separate problem. A close-based range comparison should not quietly inherit the stronger claim of two exact 24-hour endpoint trades.
Two checks worth keeping
Which daily percentage is the correct one?
The one that answers the stated question using the stated observations. In our fixture, all three first-table results are arithmetically correct. A tracker becomes misleading when it calls a calendar-day comparison a rolling 24-hour return, hides a material approximation, or presents an old observation as current.
Can I recover the old price from the badge?
You can calculate an implied denominator: with a latest price of $63 and an exact +5% change, it is 63 / 1.05 = 60. That does not recover its timestamp, venue or price type. A rounded badge also loses precision. Use the implied value as a debugging clue, then check the original source; do not manufacture a historical trade from a display label.
Reproduce the model and keep its limits attached
Download the eight fictional observations and FX assumptions, six return comparisons · CSV, currency calculation · CSV and offset-aware sequence · CSV. The original plot compares the first three measures without drawing an invented price path between observations.
The method and reproduction notes explain the assumptions. Save the package files together, then run the original Python source:
python replay.py.txt --verifyIt uses Decimal arithmetic, checks 17 fixed expectations, reproduces the calculation files and validates their checksums. It makes no network request. Missing exact endpoints are errors, not zero prices or silently interpolated values.
The dates and values were chosen to expose definitions, including illustrative instants that may be later than the source checks. They are neither observed returns nor predictions. The separate API shape checks record independent request receipts and field names; no captured market price enters this sequence.
A badge becomes easier to trust when its question is visible: this pair, this source, this ending observation, compared with that earlier observation under this clock rule.