Litecoin.watch has added three tools: a chart-reading lab, a wallet migration planner and an invoice clock simulator. They help answer different questions: what a chart leaves out, what a backup can actually restore, and which event happened before an invoice deadline.
Each tool lets you inspect the evidence behind its result. The examples below show where that matters: a smaller drawdown after changing the chart interval, a restored address list without signing keys, and a payment reported before a deadline but observed by the receiver afterward.
A smoother chart can hide the same price movement
Suppose you open a Litecoin chart, switch to a longer interval and see a smaller drawdown. It is tempting to read that as a less volatile period. The chart lab lets you check whether the difference comes from keeping fewer closing prices.
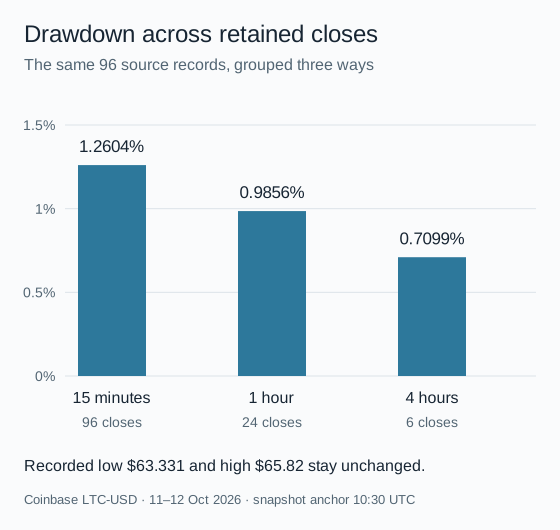
Its frozen sample contains 96 completed 15-minute LTC/USD buckets from Coinbase Exchange, covering 11 October 2026 at 10:30 UTC to 12 October at 10:30 UTC. You can regroup those same records into 24 one-hour groups or six four-hour groups. The tool retains each group's first open, last close, lowest low, highest high and summed volume.
| Grouping | Closing points | First → last close | Change between those closes | Maximum drawdown across closes |
|---|---|---|---|---|
| 15 minutes | 96 | 63.381 → 65 | +2.5544% | 1.2604% |
| 1 hour | 24 | 63.398 → 65 | +2.5269% | 0.9856% |
| 4 hours | 6 | 63.724 → 65 | +2.0024% | 0.7099% |
The highest retained close drops from $65.773 in the 15-minute view to $65.306 in the four-hour view. Yet the source's highest high remains $65.82 and its lowest low remains $63.331. Those recorded extremes survive the grouping. Some intermediate closes do not.

Try it: open the recorded-prices section, change “Group the source buckets” from 15 minutes to four hours, then compare “Closes only” with “Closes with bucket low / high.” Use the bucket selector to inspect the actual open, close, range and volume. The table and JSON/CSV downloads contain every group; the SVG download preserves the selected view and its provenance.
There is another reason the percentage changes: the first retained close is later in the longer grouping. The first and last bucket end boundaries are 23 hours 45 minutes apart in the 15-minute view, 23 hours apart in the hourly view and 20 hours apart in the four-hour view. The exact times of those closing trades are unavailable. These are first-to-last sampled-close changes, not exact 24-hour returns.
All groups start at the sample's 10:30 UTC anchor. The hourly groups run 10:30–11:30, 11:30–12:30 and so on; they are our regrouping of the saved records, not a fresh download of exchange candles aligned to full hours.
The second exercise isolates a different missing detail. Two fictional paths, 60 → 66 → 54 → 62 and 60 → 54 → 66 → 62, share the same open, high, low and close. Their largest declines across the ordered points are 18.1818% and 10.0000%. A candle does not disclose which extreme came first. These teaching paths are separate from the observed Coinbase data and are not a backtest.
The lab is useful before comparing two chart statistics or interpreting a candle. It does not provide a live executable quote or calculate your personal return after costs. The chart-reading guide explains the original sample and calculations.
A matching address list does not prove you can spend
Imagine restoring a backup, recognizing a familiar receiving address and declaring the recovery complete. The wallet migration planner separates three checks: addresses, history and balance discovery, and signing authority.
Choose the original wallet, the backup format you already have and the destination implementation. The planner then finds an exact case in its catalogue or states that it has no tested match. Here are three selections worth comparing.
| Selected route | Addresses | History / balance | Signing |
|---|---|---|---|
| Core → encrypted legacy Core wallet file → Core | Three standard address types restored in the fixed test. | Three confirmed 1-LTC regtest receipts restored on the same available test chain. | Three signed candidates passed policy checks; one was mined. |
| Electrum-LTC → master public key → Electrum-LTC | 20 receiving addresses matched. | Not tested; the experiment was offline. | The public-key-only backup had no private signing key and produced no signature. |
| Core → encrypted Core wallet file → Electrum-LTC | No tested match. | No tested match. | No tested match. |
The first row is limited to Litecoin Core 0.21.5.8, Windows RPC and an isolated regtest chain. It is not a graphical restore, mainnet payment or MWEB recovery test. The second uses Electrum-LTC 4.2.2.1 through its offline Windows CLI. Its matching address list establishes neither discovered transaction history nor spending access.
Try it: open the planner and select the “Watch-only view” example. Read all three findings. Then change the destination to another implementation. A successful result for the original route is not carried over to an untested combination.
“Not tested” is a boundary of our evidence, not a verdict that an application cannot perform the migration. Versions identify the experiments behind the result; they are not recommendations to install an old build. The planner indexes existing research and did not run another recovery experiment for this launch.
Download the blank TXT or JSON plan to keep the selected route, cited evidence and checks together. It contains eight unchecked actions and four unset verification checks. Identify your actual software version, format and configuration locally before relying on a restore. No seed, private key, password, address or balance is requested by the tool, and the planner does not load Google Analytics.
For the original methods and scope, see the recovery evidence matrix and the backup compatibility report.
“Before the deadline” depends on which event you mean
An invoice says 10:15:00 UTC. A sender reports broadcasting at 10:14:40, but the receiver first records the payment at 10:15:08. Both records can be correct: they describe different events.
The invoice clock simulator puts four fictional records around one deadline: the sender's broadcast report, the receiver's first observation, a separate observer's record of confirmation, and the service's internal credit time.
| Record | UTC time | Relative to deadline |
|---|---|---|
| Sender reports broadcast | 10:14:40 | 20 seconds before |
| Receiver first observes | 10:15:08 | 8 seconds after |
| Confirmation observed separately | 10:16:30 | 90 seconds after |
| Service credits invoice | Unknown | Unknown |
Try it: open the simulator and choose I03. Change one event using its slider or seconds field. The timeline and UTC table update together. The example's original service status stays separate; once you edit the times, that supplied status is not treated as the outcome of your variation.
The 28 seconds between the first two records are a constructed difference, not measured Litecoin propagation. Nothing in the timer decides whether a merchant must accept, reject or refund a real payment. Its terms may identify a particular event and impose conditions beyond timing.
Choose I05 for a receiver timestamp exactly at the deadline. The result is “at the deadline,” without inventing an inclusive or exclusive cutoff. Choose I08 for unavailable timing evidence. Its unknown fields stay unknown; enabling a field requires an explicit time rather than silently substituting zero.
The entered deadline includes a timezone. For example, 12:15:00 at offset +02:00 and 10:15:00Z represent the same instant. A block header timestamp is separate metadata, not proof of this receiver's arrival time. The model assumes aligned clocks for the same fictional payment and distinguishes the receiver from the separate confirmation observer.
Use the JSON or text download to save an edited lesson or explain the difference between the records. For an actual expired invoice, reconcile the original payment and obtain the receiver's instructions before making a replacement payment. Our expired-invoice guide covers the supporting records and exception questions.
Where to find the tools and their evidence
The chart lab is under Prices, the migration planner under Wallets, and the invoice clock under Payments. All three are in the tool directory, site search and their related guides. Each has a table or text explanation alongside its visual output.
The calculations run in the page. The tools do not connect to a wallet or send a payment. The chart uses a frozen venue sample, the planner classifies specific published evidence, and all ten invoice scenarios are fictional.
To check the examples, download the chart lab's grouping results and independent Fraction-based verifier, inspect the Core and Electrum recovery records, and read the invoice scenario input. Their methods identify the dataset, versions and limits behind each result.
Launch coverage checked on 13 October 2026 (Europe/Warsaw). This news reports the deployed tools and reproduces examples from their existing evidence; it announces no new wallet test, observed invoice study or market research. Drafting and scripted verification used AI assistance; no independent external review is claimed. The illustrations are original explanatory SVGs. Send corrections through our corrections page.