
Why Litecoin hashrate estimates disagree at the same block
At the same block, our node returned 3.434, 2.956 and 2.945 PH/s. We reconstructed 601 headers to show how window length changes the estimate and what a hashrate screenshot leaves out.

Sources, review record & reproducibility
Downloadable data or code · Observed data / replay.
Content review recorded: 2026-10-04. The review record does not identify a separate independent reviewer. An edited date above records an edit, not a new fact-check.
Next scheduled review: 2027-01-02.
Sources saved with the review:
- raw.githubusercontent.com · /litecoin-project/litecoin/v0.21.5.8/src/rpc/mining.cpp
- raw.githubusercontent.com · /litecoin-project/litecoin/v0.21.5.8/src/rpc/blockchain.cpp
- raw.githubusercontent.com · /litecoin-project/litecoin/v0.21.5.8/src/chain.cpp
- raw.githubusercontent.com · /litecoin-project/litecoin/v0.21.5.8/src/chain.h
- raw.githubusercontent.com · /litecoin-project/litecoin/v0.21.5.8/src/arith_uint256.cpp
- raw.githubusercontent.com · /litecoin-project/litecoin/v0.21.5.8/src/chainparams.cpp
- raw.githubusercontent.com · /litecoin-project/litecoin/v0.21.5.8/src/validation.cpp
- raw.githubusercontent.com · /litecoin-project/litecoin/v0.21.5.8/src/validation.h
- raw.githubusercontent.com · /litecoin-project/litecoin/v0.21.5.8/src/pow.cpp
- raw.githubusercontent.com · /litecoin-project/litecoin/v0.21.5.8/src/consensus/params.h
- raw.githubusercontent.com · /litecoin-project/litecoin/v0.21.5.8/src/mweb/mweb_node.cpp
- litecoin.watch · /uploads/research/network-analyses-20261004-v1/README.txt
See the article body for source links and any downloadable materials. Editorial method · Corrections · Report an issue
On this page
At the same Litecoin block, our node returned three network hashrate estimates: 3.434, 2.956 and 2.945 PH/s. Nothing about the ending block changed between those calculations. We changed how many preceding blocks the estimator used. The shortest window was 16.6% higher than the longest. A screenshot that omits that window leaves out information needed to interpret its headline number.
We saved 601 consecutive mainnet headers, asked Litecoin Core for three estimates at one fixed height, and rebuilt the arithmetic offline. The result is a practical way to check a reported hashrate jump or drop before treating it as evidence that mining machines switched on or off. This study demonstrates a measurement difference; it does not establish the cause of a change in real hashpower.
Frozen capture: 3 October 2026, 23:12:19–23:12:47 UTC, or 4 October, 01:12:19–01:12:47 in Warsaw. The ending block was 3,189,039. We used one synced, pruned Litecoin Core 0.21.5.8 node and rechecked the height boundary. These are dated observations, not live estimates. Download the capture record and saved headers.
One ending block, three different answers
We ran getnetworkhashps with windows of 30, 120 and 576 blocks, always ending at height 3,189,039. A petahash per second, written PH/s here, is 10¹⁵ hashes per second. It describes the estimator’s unit, not a direct count of running ASICs.
| Work window | Starting boundary | Headers used | Observed span | Estimated PH/s |
|---|---|---|---|---|
| 30 blocks | 3,189,009 | 31 | 55 min 50 s | 3.433609409 |
| 120 blocks | 3,188,919 | 121 | 4 h 19 min 23 s | 2.956394402 |
| 576 blocks | 3,188,463 | 577 | 20 h 49 min 41 s | 2.945409600 |
The comparison is (highest estimate ÷ lowest estimate − 1) × 100, giving 16.5749%. That is a difference between three windows at one height. Calling it a 16.6% rise in hashrate would introduce a before-and-after claim that this comparison does not make.
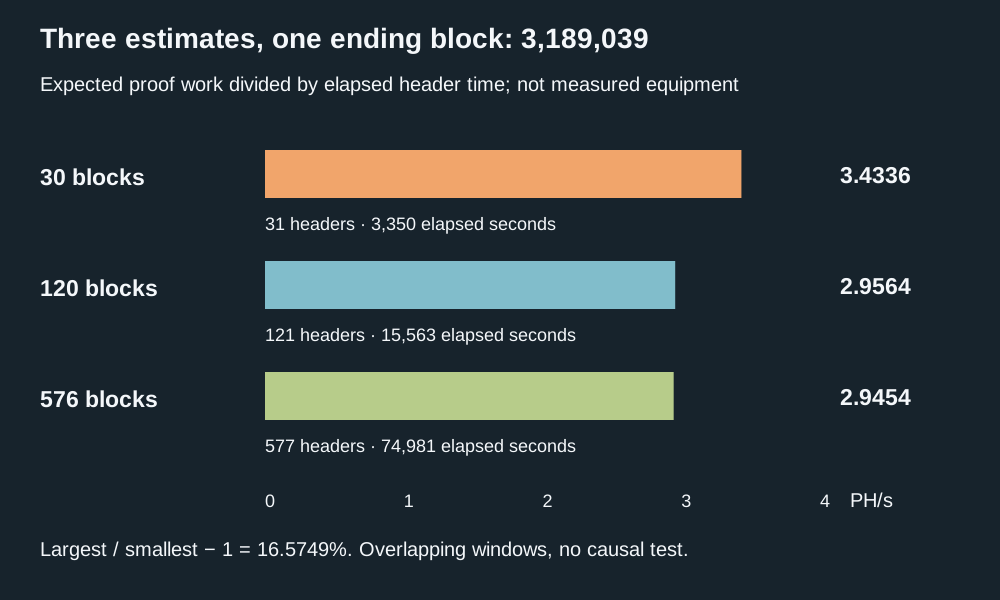
Core’s default is 120 blocks. A dashboard using 30 blocks can react more sharply to a recent run of short or long intervals. A 576-block estimate includes much more earlier work and time. Neither label, by itself, establishes that a provider copied Core’s exact calculation. Check its published method before comparing the figures.
What the estimator measures
A miner does not report every hash it tries to the blockchain. The chain reveals successful blocks and the difficulty targets those blocks had to meet. Core uses their accumulated expected proof work and recorded header times to estimate a rate.
For a window of N blocks ending at H, the pinned Core implementation calculates the change in chainwork between H − N and H, then divides it by the difference between the maximum and minimum header timestamp across H − N through H. This is why the calculation needs N + 1 headers even though its work difference counts N blocks.
The starting boundary’s chainwork is subtracted. Its timestamp still participates in the time range. Losing that distinction creates an easy off-by-one error when someone tries to reproduce a dashboard with a CSV.
| Quantity | What it describes | What it does not establish |
|---|---|---|
| Difficulty / target | The proof-of-work threshold applicable to a block | How many machines are running at that instant |
| Chainwork | Accumulated expected proof work along the chain | A log of every hash miners actually attempted |
| Estimated hashrate | Expected work divided by the selected header-time range | A hardware census, a pool ownership map or the cause of a change |
A miner’s local hashrate display, a pool’s estimate from submitted shares and a chain-based network estimate describe different observations. Matching units do not make their sampling periods or denominators identical.
576 blocks did not cover a full day
Litecoin’s 150-second target interval makes 576 blocks a convenient nominal daily window: 576 × 150 = 86,400 seconds. But the observed time range in our 576-block calculation was 74,981 seconds, or 20 hours, 49 minutes and 41 seconds.
Those two durations answer different questions. One is the protocol’s target-rate arithmetic. The other comes from the headers in this particular capture. Labelling the latter “the last 24 hours” would incorrectly describe its coverage.
A genuine clock-based 24-hour report must specify a start and end time and how it selects blocks around those boundaries. A fixed-block report should disclose its actual elapsed span. This matters when comparing a daily mining statement with a network chart: the statement can cover a calendar day while the chart’s latest 576-block estimate covers a different period.
We rebuilt the result from the saved headers
The saved range is heights 3,188,439–3,189,039 inclusive. Our script checked the links between consecutive headers and all 600 adjacent chainwork increments. Each increment matched the proof contribution derived from that block’s encoded target.
The Core proof-work function computes an integer equivalent of floor(2²⁵⁶ ÷ (target + 1)). The compact-target implementation supplies the decoding rules. Our reconstruction uses integer work and a high-precision decimal division; the node returns a floating-point estimate. All three comparisons agreed within the declared relative tolerance of 10⁻¹².
Every saved header had the same bits value, 19301c71. Consequently, the differing estimates in this captured range did not result from mixing different per-block targets. That is a useful control for this example. It does not establish that the amount of running hashpower was constant.
The node’s ending block hash begins b53ea8dc31a0622a; the full hash is preserved in the capture record. Recording a hash as well as a height makes the boundary auditable if a later chain reorganization changes which block occupies that height.
The short window moved much more across this sample
We also shifted each window through every eligible ending height in the saved range. This produced 571 overlapping 30-block estimates and 481 overlapping 120-block estimates. These are calculations from the same header set, rather than hundreds of separate network measurements.
| Window | Eligible ending heights | Number of estimates | Minimum PH/s | Maximum PH/s |
|---|---|---|---|---|
| 30 blocks | 3,188,469–3,189,039 | 571 | 1.995246 | 4.790750 |
| 120 blocks | 3,188,559–3,189,039 | 481 | 2.531519 | 3.446211 |
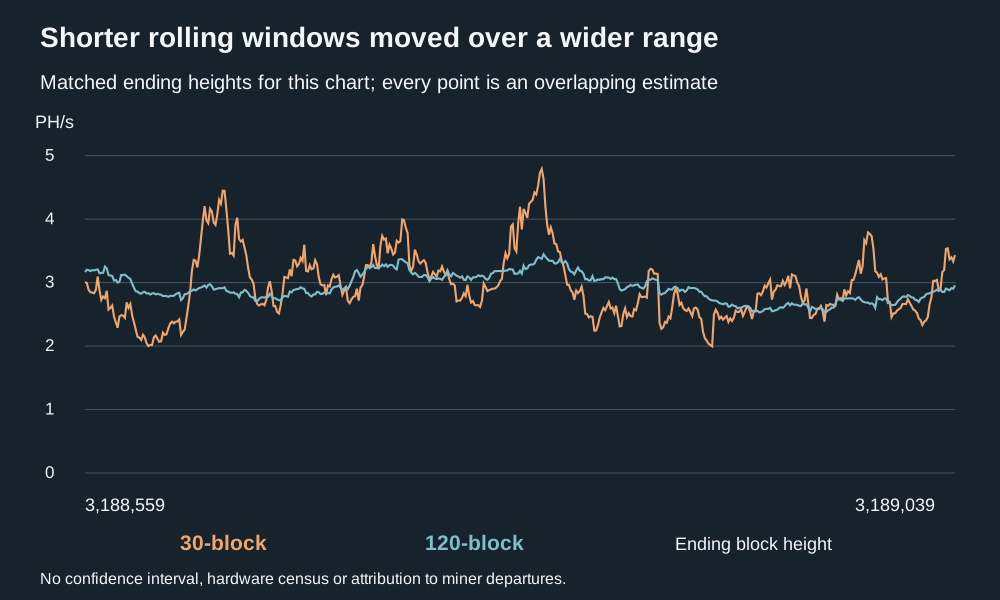
The 30-block series had a wider observed range. Its next point replaces only one boundary block, so adjacent points share nearly all their inputs. The 120-block series is also heavily overlapping. Treating those points as independent observations would exaggerate how much separate evidence the chart contains.
The eligible starting heights differ because a 120-block estimate needs more preceding history. The two min–max ranges therefore have different supports as well as different window lengths. Their extrema are descriptive results for this saved sample; they are not a controlled test isolating window length as the only possible cause, and they are not bounds on future hashrate.
Header time is not the time our node received a block
The RPC’s time field comes from a block header. The mediantime field is a different quantity. Neither is a timestamp from our node’s arrival log. Our capture retrieved existing headers; it did not watch these 601 blocks arrive in real time.
The timestamp rules require a header to exceed the preceding block’s median time past and restrict overly future-dated blocks. That does not require each header timestamp to exceed its immediate predecessor. Core’s median calculation uses up to 11 headers.
In this particular saved range, all adjacent timestamp differences were positive. The maximum-minus-minimum time range also equalled the endpoint difference in every rolling estimate we calculated. We therefore did not observe an endpoint-subtraction error here. The distinction remains necessary to reproduce the algorithm correctly on other samples.
Do not apply an ideal block-arrival model to these recorded timestamps and present its output as a measured probability of miner exits. A separate arrival-time study would need a defined observation process and its own treatment of missing data.
How to compare two hashrate screenshots
Before deciding that one chart disproves another, gather the following information. A number without its denominator can be accurate under one method and misleading when moved into a different comparison.
| Check | Why it changes the comparison |
|---|---|
| Network and units | Confirm Litecoin mainnet and convert GH/s, TH/s and PH/s consistently |
| Ending height and hash | Separate a window difference from a newer observation or a different chain boundary |
| Window length | Record whether it is blocks, clock hours or another smoothing rule |
| Actual elapsed span | A nominal 576-block day need not last 24 hours |
| Work and time method | Check chainwork, per-block targets, endpoint times, extrema or other provider rules |
| Refresh time and rounding | A cached chart can differ from a fresh RPC response even with the same stated method |
| Source and claim | Distinguish chain estimation, accepted pool shares and hardware telemetry before drawing conclusions |
If either provider omits these fields, record the comparison as unresolved. Do not fill the missing window with an assumption just because “daily hashrate” sounds familiar. The downloadable checklist provides a small worksheet for keeping the evidence beside your screenshots.
What this means for miners and everyday users
For a miner, a chain-based rate helps describe network conditions. It does not replace accepted-share records, actual credited rewards or measured electricity consumption. Our mining calculator separates coin difficulties and costs; the seven-configuration mining study preserves its own dated inputs. A new screenshot should not silently replace one input in that frozen study.
For someone sending Litecoin, a short-window hashrate estimate is not a confirmation-time promise. Transaction selection and the time of future blocks are separate questions. Check network conditions, your actual transaction status and the recipient’s confirmation requirement. Our confirmation-time pilot uses a different observation process and explains its open outcomes and collection gaps.
The same boundary discipline matters for halving estimates. The subsidy changes at a height; a calendar countdown extrapolates from block timing. A rapidly moving short-window rate does not change the scheduled halving height or justify a precise future date.
This capture establishes that several reproducible rates can coexist at one ending block. It does not tell us which miners joined or left, how much hardware exists, who owns it, or whether the network has become safer or less safe.
The same capture also supports our 144-block fee analysis, which reconciles fees with the actual coinbase amounts instead of treating a rate estimate as revenue.
Check the study yourself
Download the research package, verify the SHA-256 checksums and follow the reproduction instructions. The standard-library analysis script recalculates the saved data offline. It also reconstructs the accompanying fee study; it does not obtain newer data or run mining hardware.
For the numbers behind the charts, use the three fixed-height windows, rolling estimates and full results. The read-only capture script documents the RPC process separately. A fresh run can capture a different height and results; offline reproduction preserves this article’s boundaries.
This is a one-node mainnet observation and source-based reconstruction. Pruning did not prevent access to the retained header index. We did not survey other nodes, measure propagation, inspect mining hardware or attribute blocks to operators. An arithmetic agreement with Core verifies the reconstruction; it does not independently establish the cause of the estimates. Report a reproducible error through our corrections page.
AI-assisted research, drafting and code; original SVG figures and scripted checks of frozen node data. No independent external review or physical miner test is claimed. The illustration is editorial artwork, not a photograph of hardware measured for this study.



Track Litecoin in real time
Rates for 30+ currencies. Check each tool for its latest source timestamp.
Open dashboard